
Everything Looks Horrible
The case for $200+ oil and a prolonged global downturn.

I have spent considerable time looking for a reason not to make the case of $200+ oil price and a global downturn. I cannot find a compelling one.
Over several months I have been publishing a body of work arguing that the global economy was heading for something severe and prolonged, through mechanisms that standard policy responses cannot address. That is not a comfortable position. The default view is that the catastrophists are usually wrong and things will work out. I am aware of the analyst who has predicted eight of the past two downturns. Yet the argument I am making does not rest on temperament – it rests on mechanisms that can be examined, challenged, and tested against the data. And the data is not sympathetic to the optimistic view.
The structure of the argument is this. Several independent causal chains are running simultaneously, through different channels and with different transmission lags. A war that has closed the world’s most important energy chokepoint and damaged infrastructure that will take years to restore, not weeks. A financial system that amplifies shocks rather than absorbing them, through a global liquidity withdrawal transmitting through three simultaneous channels, leveraged positions in non-bank lending sectors, and a central bank bind that leaves rates too high for the slowing economy and too low for still-elevated inflation. A coercion theory – the misapplied US blockade – that does not apply to Iran’s fiscal and monetary architecture, which means the war ends when it ends rather than when Washington needs it to. A pre-existing global debt position stretched to the point where the IMF now projects government debt breaching 100% of GDP globally by 2029 leaving materially less room to respond than in any prior cycle. These are different problems that converge on the same outcome through independent routes, which is why it is categorised as overdetermined – resolving one does not rescue the overall case.
The supply calculation is not complicated. The Strait carries roughly 20% of global oil consumption. Bypass routes and demand reduction absorb perhaps 5–10% of that gap, leaving a structural shortfall of 10–15%. That does not translate into just a 10–15% price increase – oil demand is highly inelastic. In 1973, a disruption of 4-7% of global supply produced a near-quadrupling of price; in 1979, a disruption of 3-4% partially offset by compensation from other producers produced a doubling. A shortfall twice as large points to $200 as a floor, not a ceiling.
The range of outcomes this could theoretically produce runs from uncomfortable to historically unusual and hence economically severe. My base case is the middle path, whereby the Strait of Hormuz does not fully reopen until late July or August, the uncertainty makes resumption gradual rather than clean, and the price arithmetic puts Brent over $200 for an extended period with the economic consequences that implies.
In the most favourable path, Hormuz reopens by June, but the physical ramp back to pre-war flows takes months rather than days – Sultan Al Jaber, CEO of ADNOC, told The National that Gulf flows would take at least four months to recover to 80% of pre-war levels even under immediate resolution, leaving a residual shortfall of 5 mb/d beyond that. The global inventory rebuild will add demand against still-constrained supply, and the economic damage will accumulate longer than the diplomatic timeline implies, while AI investment provides a bifurcated contribution – either a partial offset or itself breaking under tightening financial conditions.
In the worst path, closure persists well into the second half of the year, non-linear price dynamics activate, financial amplification adds a risk premium on top of physical scarcity, and $300 Brent becomes possible rather than an abstraction.
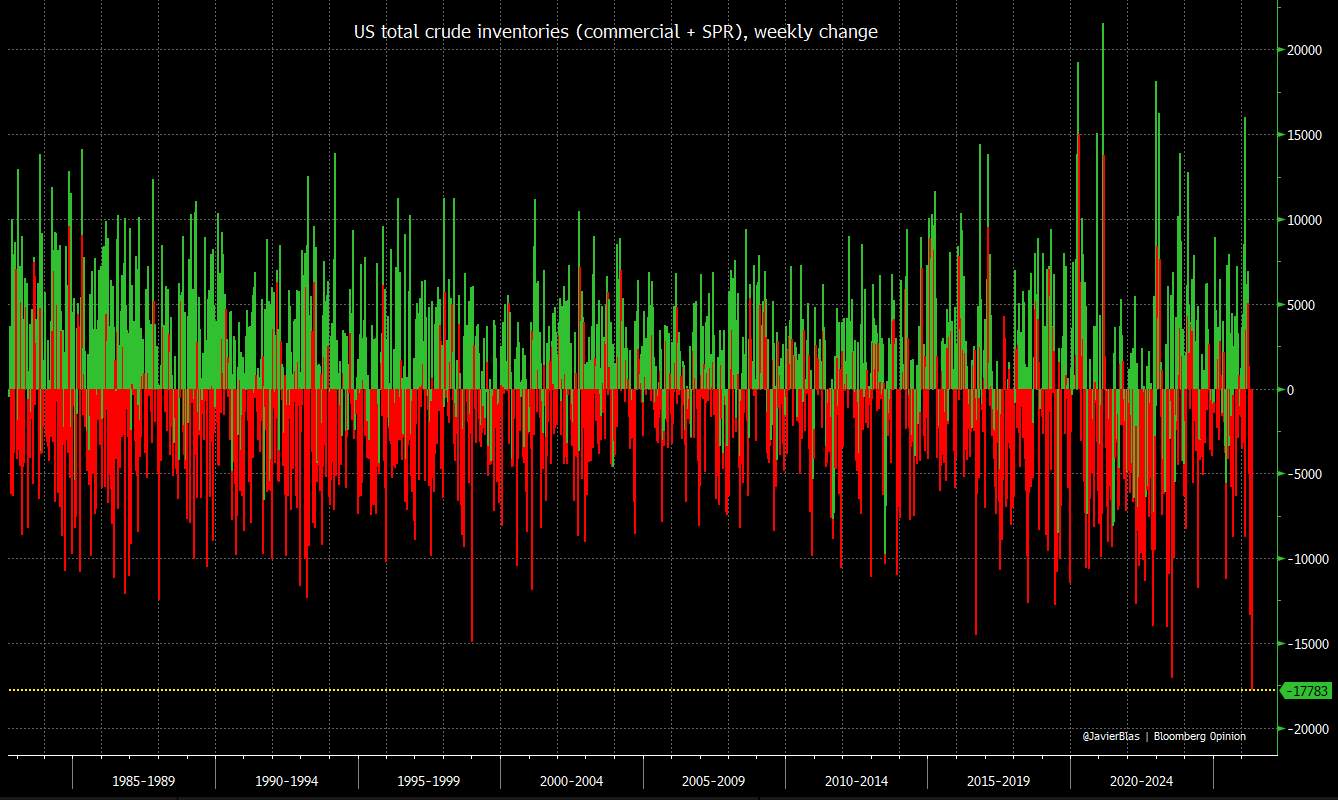
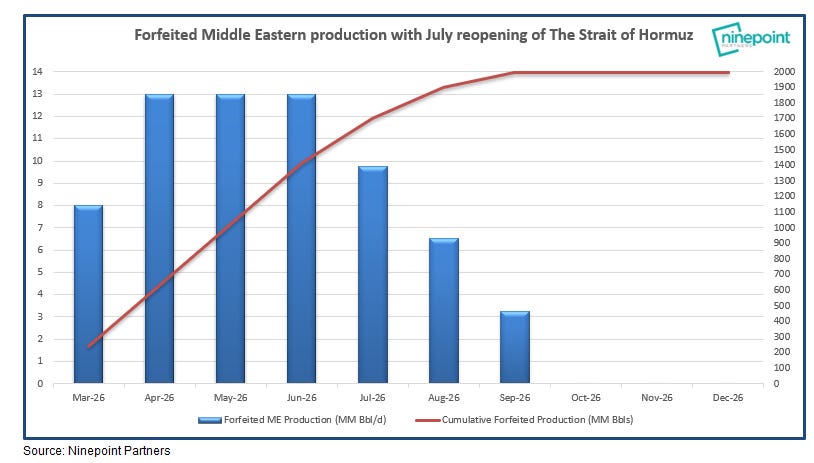
The inventory arithmetic is less agnostic than the market-pricing question, and it does produce a date range. US total crude inventories – commercial and strategic combined – are drawing at 17.8 million barrels in a single week, the largest weekly draw in more than forty years of recorded data. Global observed draws ran at 120-130 million barrels per month through March and April, and the buffer above minimum working inventory levels exhausts in an August to October window at current rates. Even on the assumption that Hormuz reopens in July, cumulative forfeited Middle Eastern production reaches approximately two billion barrels before normalisation – a volume that cannot be absorbed without price consequences. Corporate Q2 earnings, reported from July, will be the first time the feedstock constraint appears in industrial results rather than energy sector data alone.
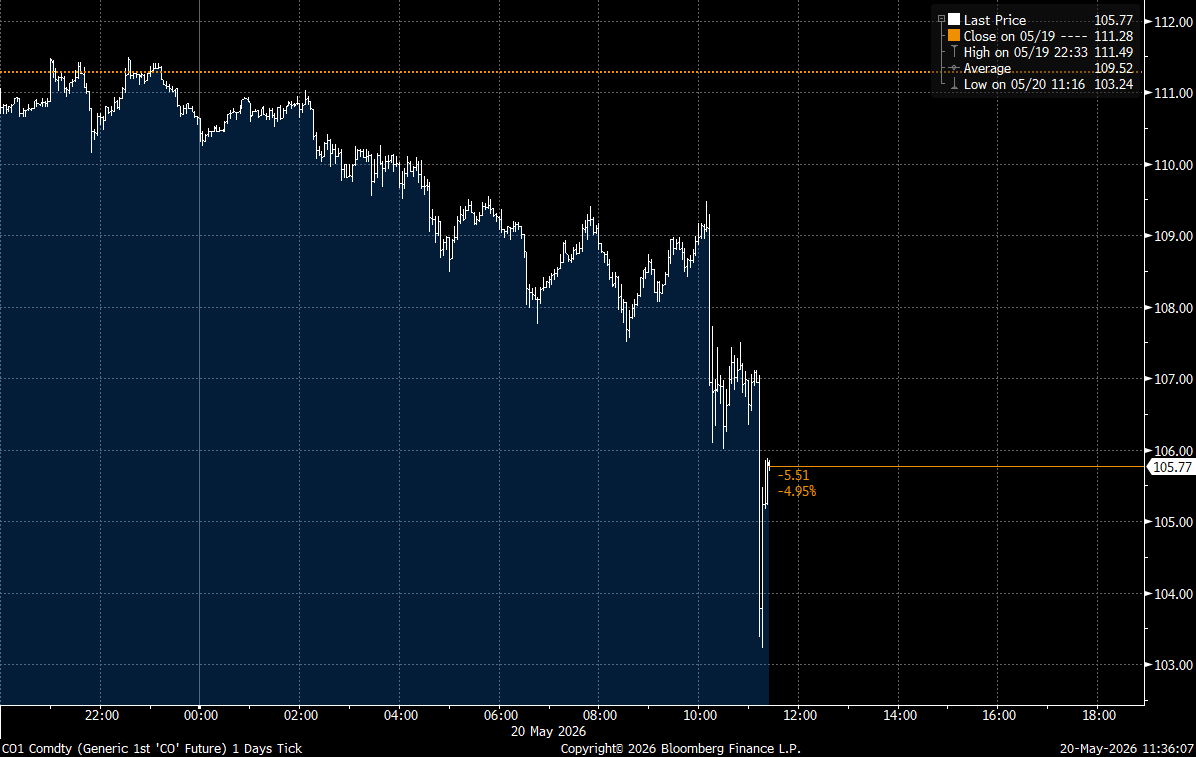
What this analysis cannot give you is the precise date on which financial markets acknowledge what the physical data has been increasingly showing for weeks. That gap can persist far longer than physical conditions alone would imply – Brent dropped nearly 5% yesterday on a single statement about negotiations, despite Hormuz remaining physically closed and the weekly draw continuing at record pace. But inventory data gives that gap a mathematical end point, and sets a window within which the physical constraint will operate directly on prices regardless of how markets are interpreting diplomatic signals.
The next part of this series will set out the scenario analysis in more detail – if you want the forecast without the detailed arguments and workings, that is the piece to read. The pieces that follow will work through each thread of the argument and the evidence behind it. The final piece synthesises them and will be updated as events develop.
There's even a worst case than this, Nick. If Trump resumes the war and Iran makes good on its threat to destroy more middle eastern infrastructure, and/or if the Houthis decide to close the Bab al-Mandan, we could get above 30% loss of supply. What then?
Although financial markets have been reacting to jawbones rather than the physical reality of the situation I do think its fair to suggest that mid June into July is when we can expect the pricing to overwhelm any synthetic depreciation attempts at price control because we will be approaching operational floors and we cannot actually touch operational floors. TLDR price adjusts parabolically June forward because tank bottoms are a limit we cannot hit.