
Patient Zero: Covid plus GFC?
The Strait has been closed for ten weeks. The epidemic has already moved past the primary stage.


The Strait of Hormuz is patient zero. Disruption propagates outward from it through the global supply system in a similar way to how an infectious disease moves through a population. It moves along input-output chains and in branching waves, with each disrupted node becoming a new transmission point into the industries that depend on its outputs. Ten weeks in, primary infections are visible in the data. Secondary infections are incubating behind inventory buffers that are drawing down faster than the consensus has forecast. The market, meanwhile, is asking when patient zero recovers, which is a reasonable question, but not the most important one.
The Wrong Collapse addresses the recovery timeline directly: Iran’s economy deteriorates on a long slope rather than collapsing through the mechanisms the collapse predictions invoke, which means the Strait stays closed longer than markets have priced. But the companion problem is what happens to the global supply system during that interval. An epidemic model explains why the duration of patient zero’s infectiousness matters far more than a standard supply disruption analysis would suggest. Epidemics have their own momentum once the branching has begun, and treating patient zero does not stop infections that have already moved past the primary stage.
Why an epidemic model
The standard economic treatment of Hormuz closure is a supply disruption: a quantity reduction and a price adjustment, and eventually a new equilibrium through demand destruction and supply substitution. That model works adequately for shocks that are bounded and immediately apparent – a brief port closure, a pipeline outage in a single region, a weather event – but it fails for a propagation event, where the initial shock enters the supply chain through feedstock-dependent industries and each disrupted industry then passes the disruption on to those that depend on its outputs.
Inventory buffers absorb the primary shock initially, keeping downstream operations apparently normal while stocks draw down, but when the buffers exhaust, those supply chains break. Each stage is viewed by markets as isolated and temporary while cumulative damage builds across the economy. Different feedstocks have different buffer depths, hence different incubation periods. The chains with thin inventories go symptomatic first and will be apparent now. The chains with deeper buffers look unaffected – operations continuing with normal prices – and will keep looking unaffected until their stocks exhaust. When that happens, they go symptomatic at the same time as the chains that depend on them. By the time the aggregate data captures the full disruption, it has already progressed through multiple production cycles. The cracker margin signal is a leading indicator of this: cracker margins tighten before resin spot prices move, resin moves before earnings revisions, and earnings revise before industrial output data registers the disruption. The lag at each stage runs to three to six months. The cracker margin has been widening since the first days of the closure.
The standard substitution argument depends on three conditions holding at once: (1) alternative supply exists at sufficient volume, (2) it can reach existing processing infrastructure within the relevant time window, and (3) it is chemically compatible with that infrastructure. On volume, the 20:1 ratio of lost to replacement daily output answers the first. On routing, Cape of Good Hope rerouting adds weeks to delivery times and significant freight cost, and cannot restore the throughput or timing that just-in-time supply chains require. The harder limit is chemistry: refineries and crackers are configured for particular crude and intermediate grades, and specific hydrocarbon streams are not globally fungible. A cracker configured for Arab Light naphtha cannot simply switch to West African condensate without the yield falling, the catalyst degrading, and the output failing specification. Downstream polymer, pharmaceutical, and agricultural chemical chains face the same constraint – alternative sources exist, but they are the wrong grade and on the wrong schedule.
The calibration
This is a dialled-back version of two historical comparisons. The point is not that this is of the magnitude of Covid plus the GFC, but rather it is that specific mechanisms from each are continuing, at lower intensity, and in combination.
Covid disrupted approximately 100% of global supply chains roughly simultaneously, making the shock immediately apparent in its full scale even when the duration was uncertain. Closing Hormuz has disrupted approximately 20% of global hydrocarbon flows, sequentially, with staggered incubation periods that allow each wave to be rationalised individually. The sequential nature is what the Covid comparison initially obscures: each wave can be absorbed by the consensus as a temporary and manageable event – which it may be, considered in isolation – while the cumulative damage builds across the economy. Covid was immediately legible because the shock essentially struck all at once, but this situation is less legible because it appears in instalments.
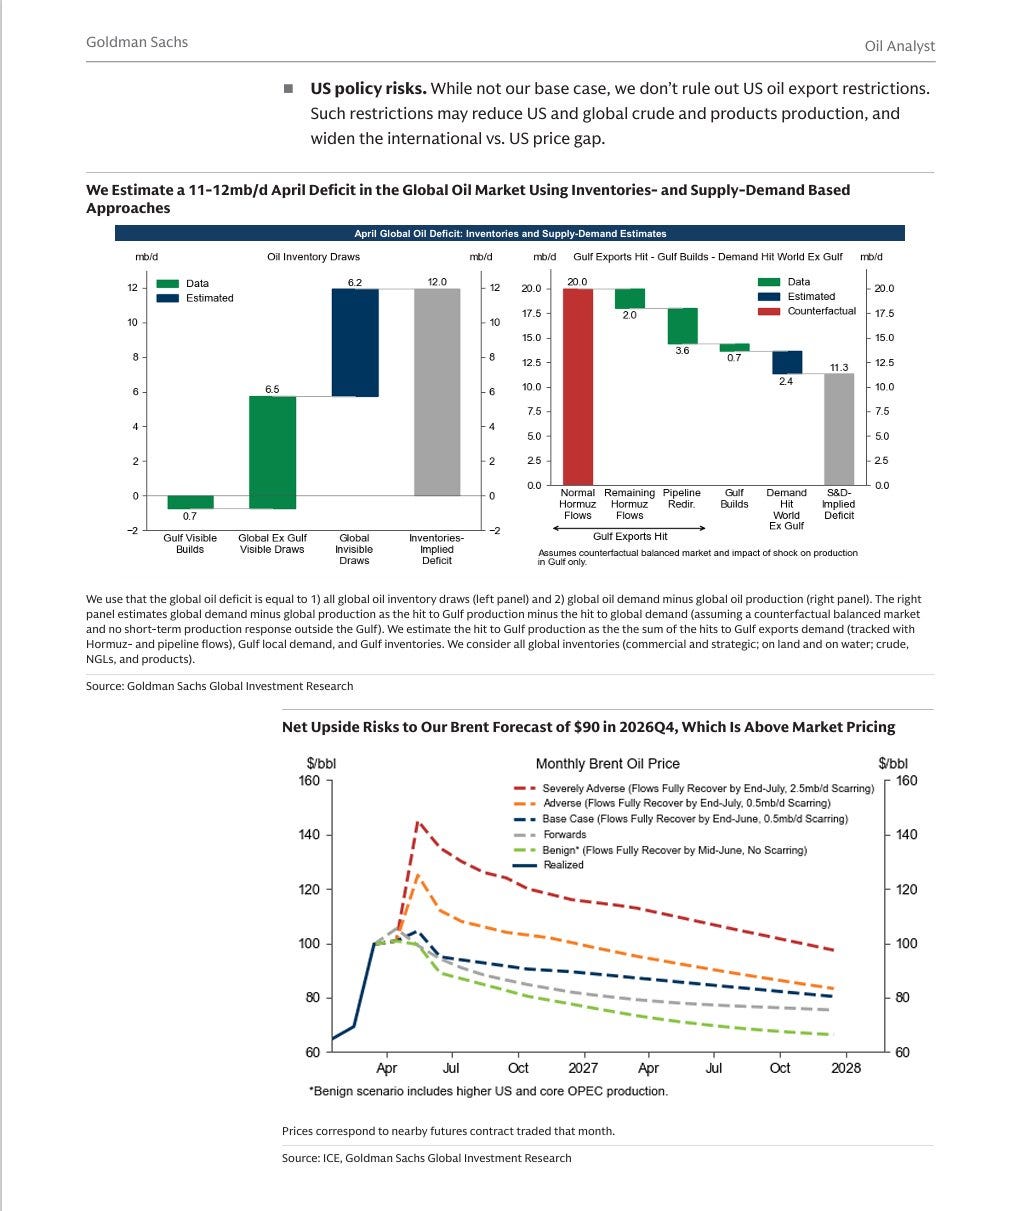
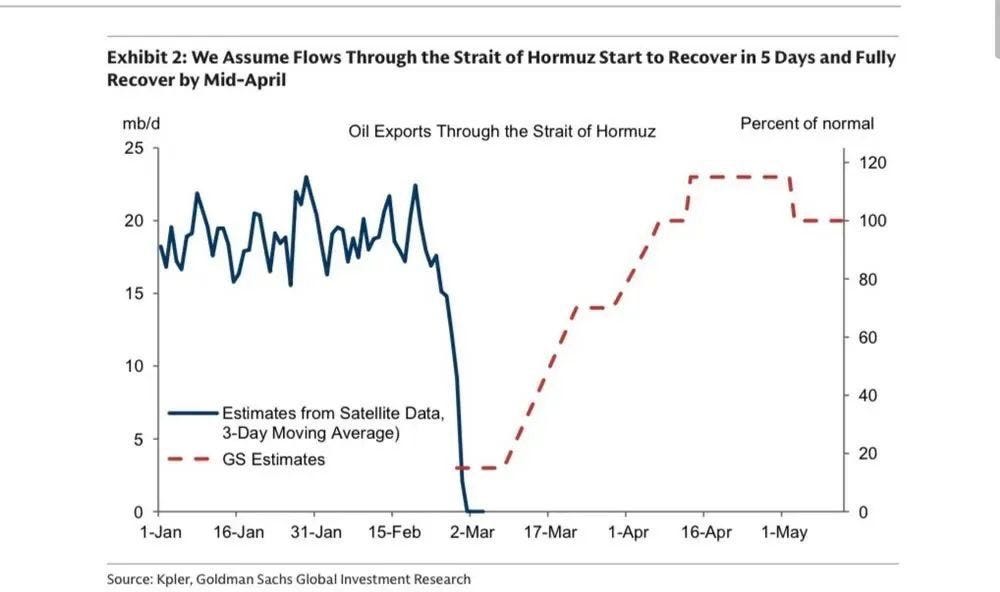
The GFC comparison is narrower – the subprime daisy-chain has no equivalent here, but the load-bearing assumption failure does. Goldman’s scenario set for Hormuz contains three recovery scenarios and no persistence scenarios. Their critical assumption is that the Strait reopens before the inventory floor is reached – similar to the recovery assumptions that rating agency models were using in 2006 and 2007, though the parallel runs only that far and not to what followed. When a single assumption is doing that much work, the question is what happens to everything priced on top of it when the assumption fails.
The primary infections
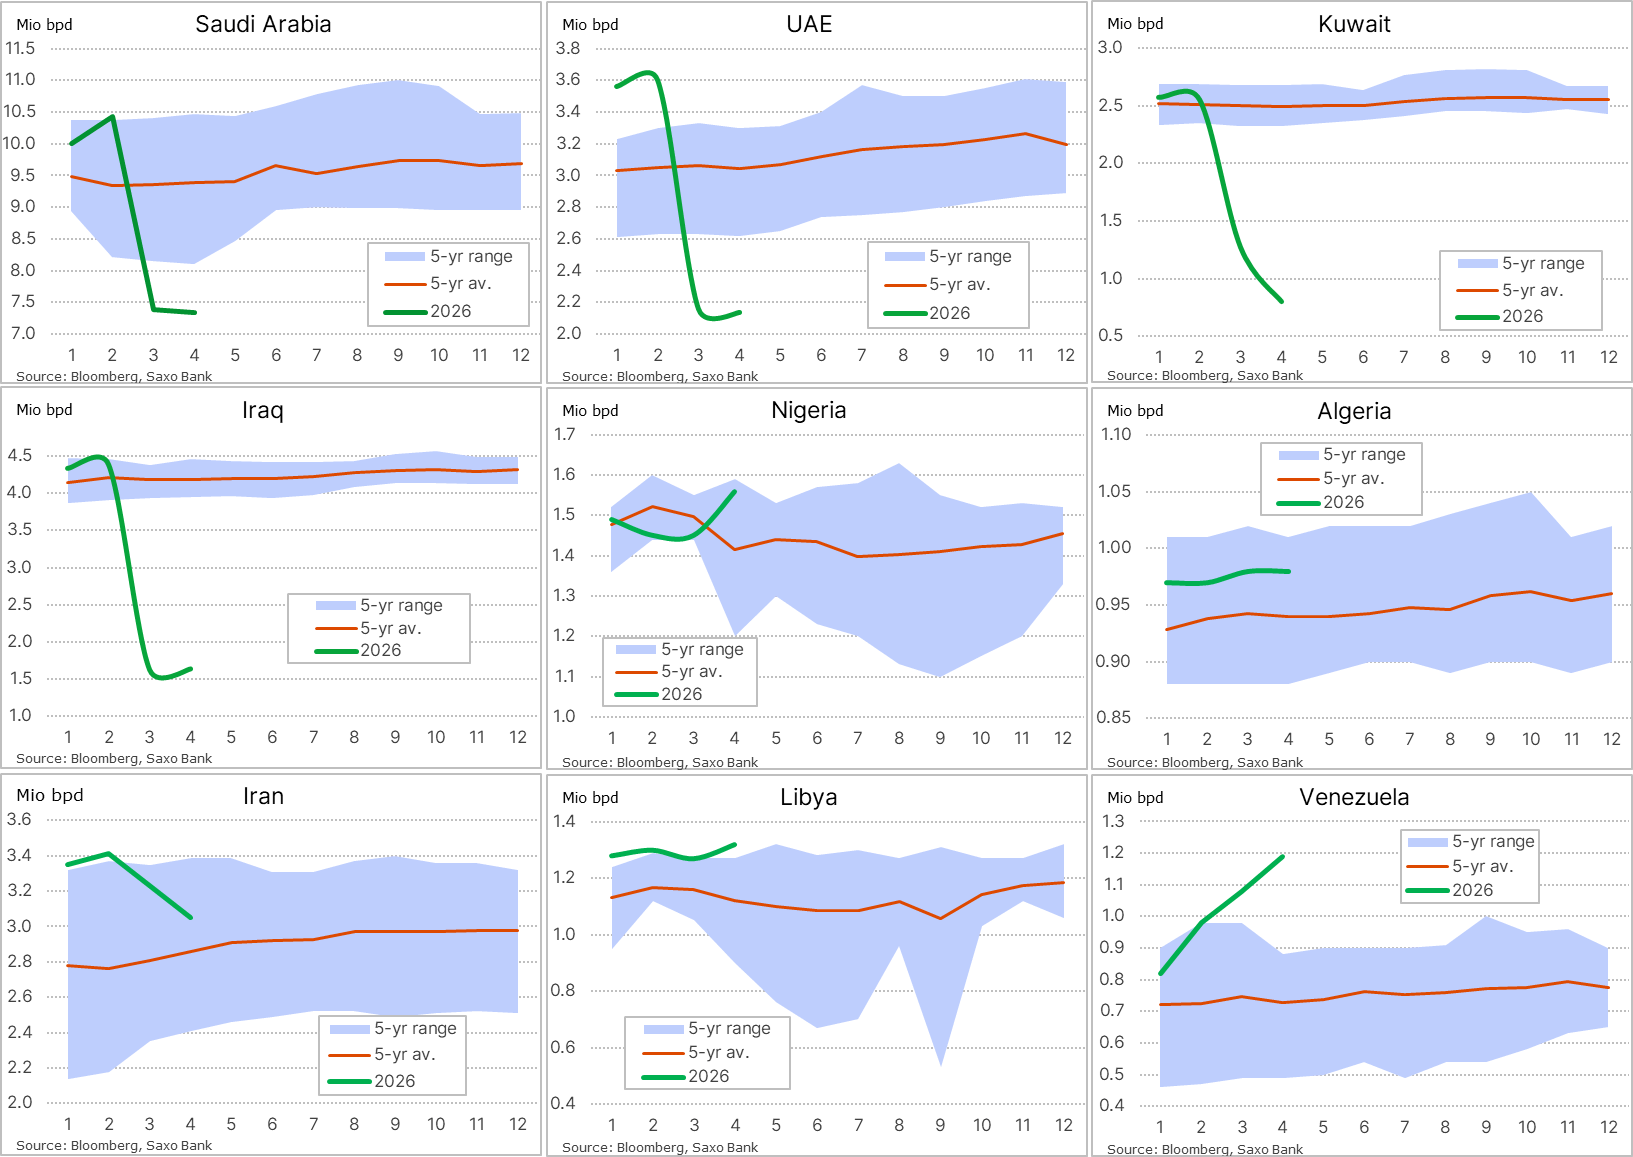
The primary data is already unambiguous. Goldman’s own production figures show a 14.5mb/d loss against a 0.7mb/d non-Gulf supply response – a 20:1 ratio of lost to replacement output in daily production terms, with the recovery assumption carrying the remaining weight. Bloomberg’s latest monthly production survey has Iraq at -63% and Kuwait at -69% from pre-war levels. Saudi Arabia and the UAE, partially shielded by pipeline bypass capacity, are at -29% and -40%, respectively.
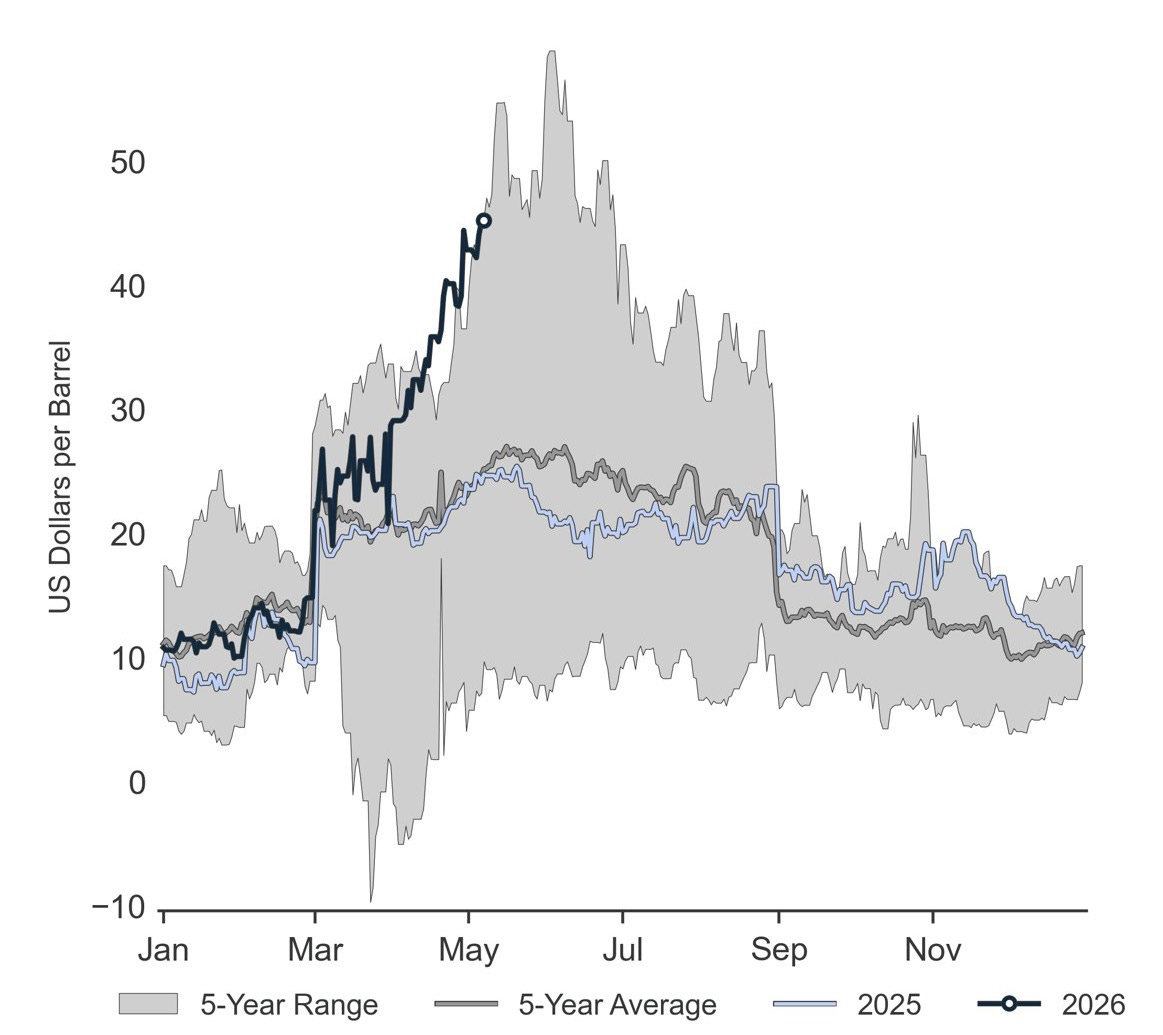
The gasoline crack spread – the refining margin – is tracking 2022’s peak trajectory, well above the upper bound of the five-year range. WTI spot, meanwhile, fell from $102 to $95 in the week ending 8 May. Crude falling while refined product margins hit records demonstrates the simultaneous effects of feedstock volume constraint and demand destruction in different parts of the system – the distinction between a hydrocarbon shock and an oil price shock, as explained in an earlier piece. Price signals are working on demand, but they cannot work on a volume problem.
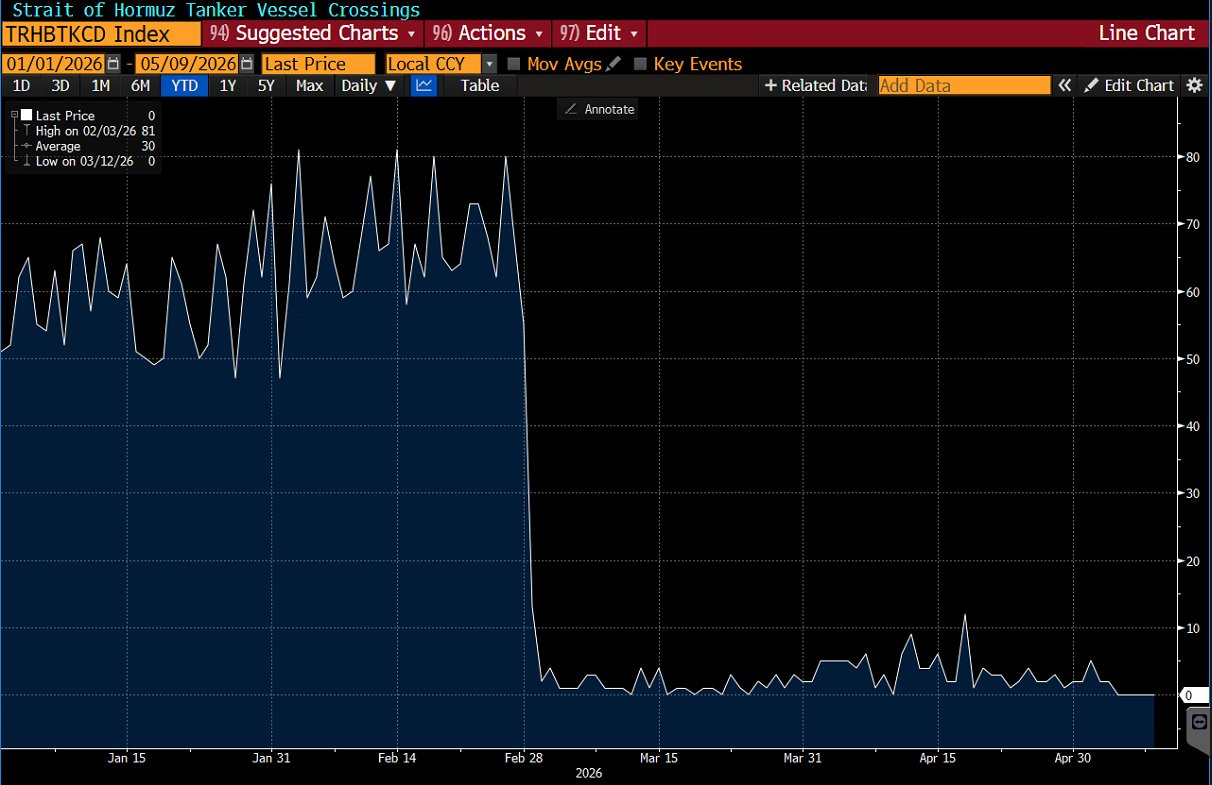
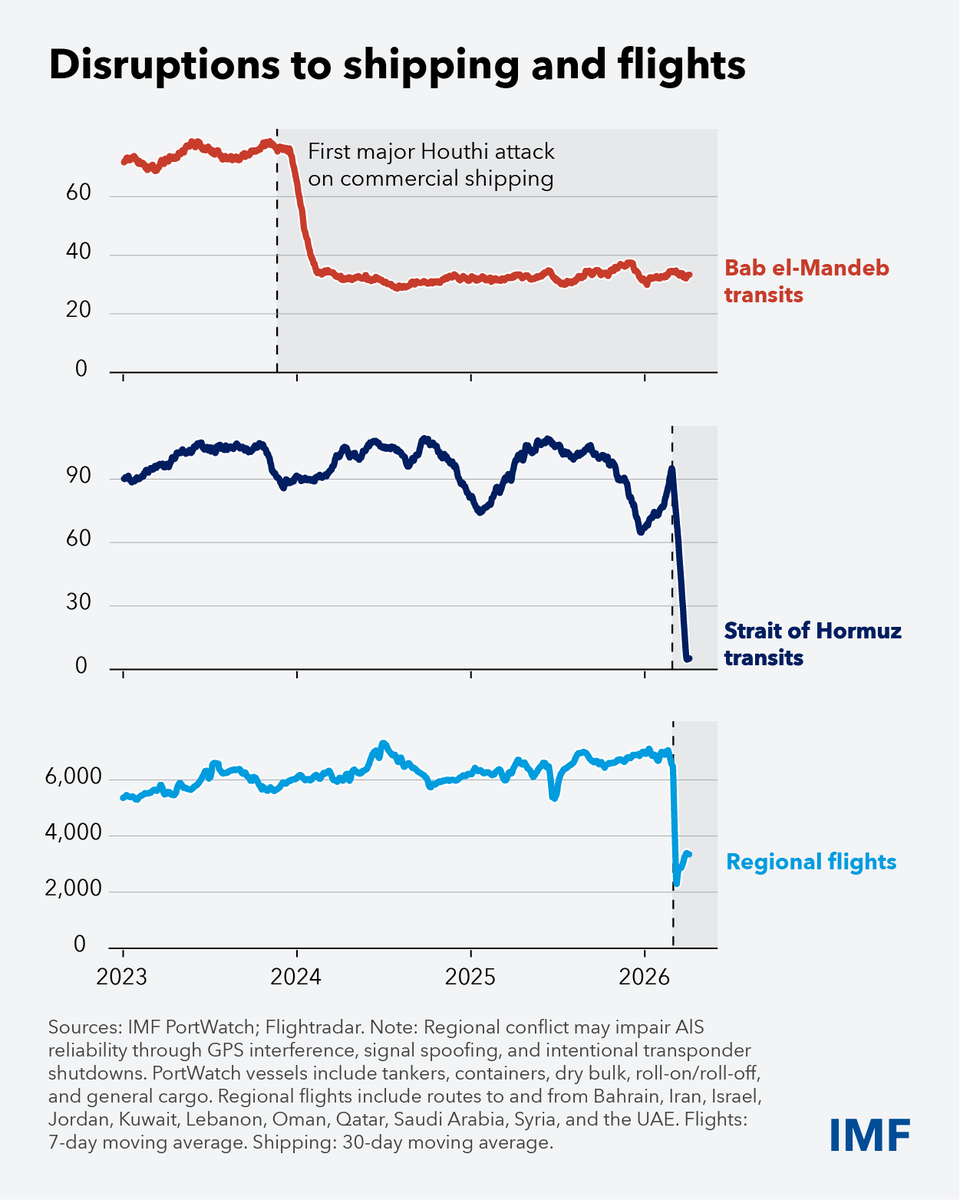
Three maritime intelligence trackers – Windward, HormuzTracker, and Hormuz Strait Monitor – provide a daily picture of conditions at the Strait. The signal across all three has been consistent: commercial throughput remains effectively at zero against a normal baseline near 60 vessels per day, while war-risk premiums remain 8-15x normal. Where transit numbers have ticked up on individual days, the marginal traffic has been operating covertly, with transponders suppressed. The shadow fleet is expanding, but commercial shipping is still frozen.
The incubation timer
JPMorgan’s inventory analysis – drawing on Kpler, the IEA, the EIA, and JODI – provides the clearest timeline for when the primary infection moves from visible to critical. World oil inventories will hit the operational stress level of 7.6 billion barrels in June under a no-resolution scenario with 5.6mb/d demand reduction. The operational floor – minimum inventory required to keep pipelines functioning and refineries operating – is reached at 6.8 billion barrels in September.
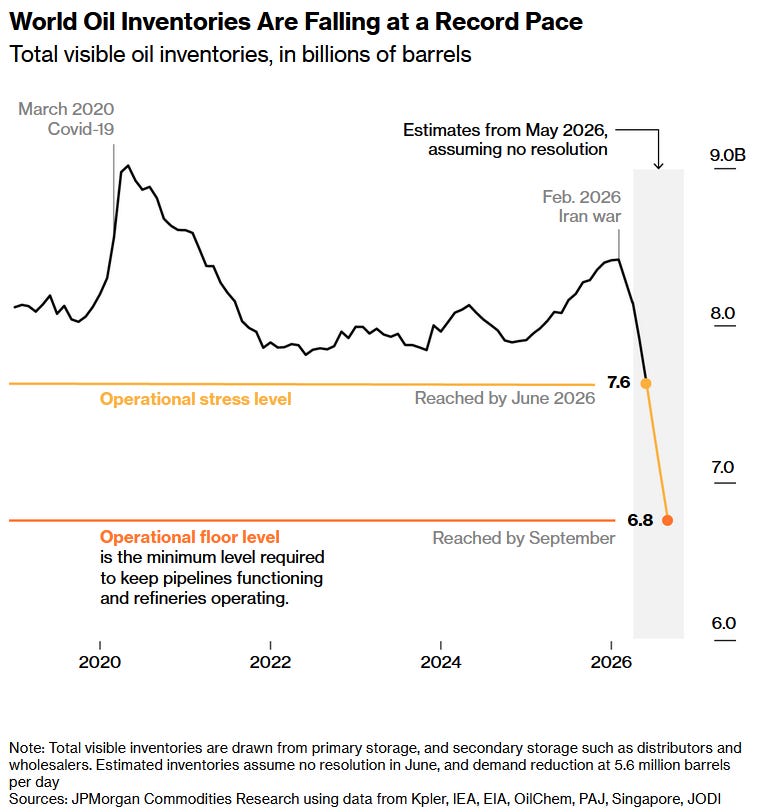
Below that floor the system stops being a “chronic shortage, slower growth” scenario and becomes a physical inability-to-operate scenario. Energy analyst Art Berman described the current configuration last week as markets “adapting to a quieter future of chronic shortage and demand destruction”. That is an accurate description of the path above the floor, but it does not describe what happens below it where chronic shortage is no longer applicable.
Asian refiners are compounding this. They are cutting runs – not for lack of crude, but because committing to WTI cargoes at $110/bbl for July delivery is irrational when Iraqi barrels might be available at $85 if the Strait reopens first. This is game theory – the prisoner’s dilemma. Waiting is each refiner’s dominant choice, and the aggregate of those individually rational decisions produces the collective outcome each was trying to avoid – the bidding war for crude that they were trying to defer. HFI Research described this as a “comedy sketch” – Asian refineries waiting until product storage is gone before buying crude. Joseph Heller would have recognised it.
Secondary infections
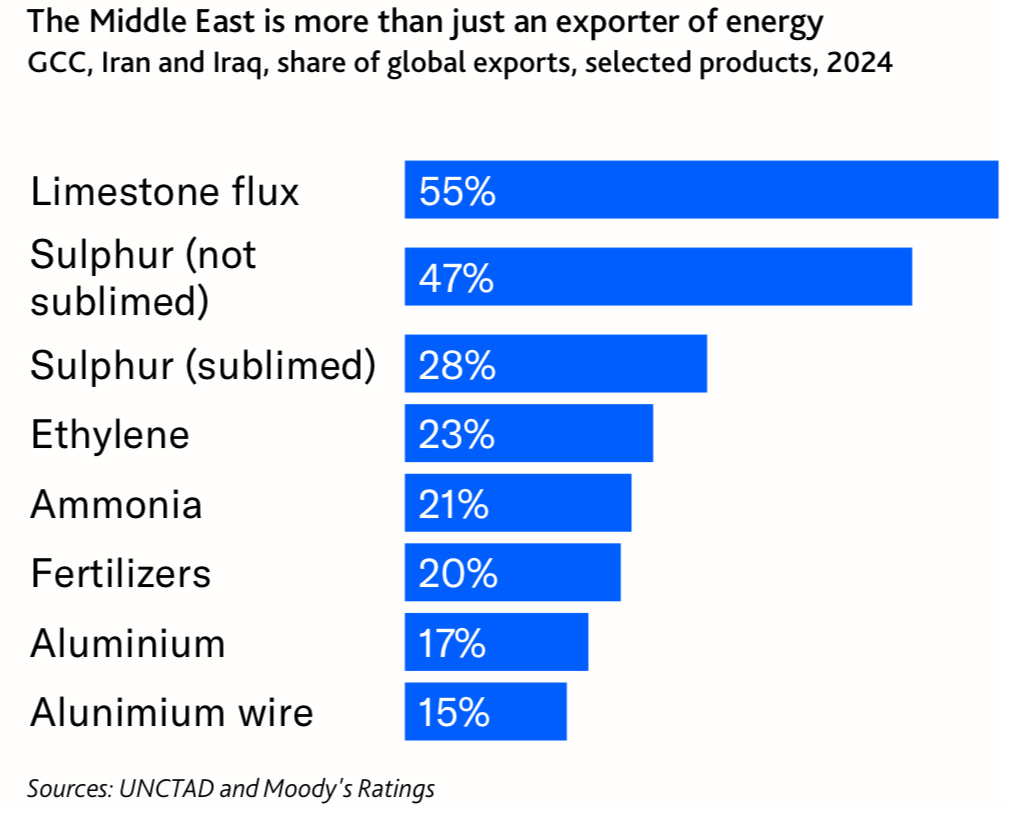
The chains that take primary outputs as inputs are moving from incubation toward symptomatic. The sulphur chain illustrates how this works. Sulphur is a byproduct of Gulf oil and gas, and has effectively been trapped in the Gulf as crude since the conflict began. It is a critical input for copper mining through solvent extraction and electrowinning (SX-EW) processes and for nickel production in high-pressure acid leaching (HPAL) plants – about one-fifth of global primary refined copper comes from SX-EW operations. The Democratic Republic of Congo, the world’s second-largest copper producer, relies on the Gulf for most of its sulphur imports, and Indonesia, the world’s largest nickel producer, sources approximately 75% of its sulphur requirements from the Middle East.
In mid-April as acid prices surged, Macquarie Research estimated that Indonesian HPAL production costs had risen by 24% to $US18,000 per tonne, while the LME nickel price had moved to an 11-week high. Natixis calculated that sulphur accounts for 20% of cash production costs for Congo’s SX-EW copper producers, with every $US100 per tonne rise in sulphur prices translating into a 4% rise in operating costs.
These are secondary infections, originating in the Gulf, and arriving in metals markets in Kinshasa, Santiago, and Sulawesi weeks later, through supply chains that most energy-market models do not connect to Hormuz at all. When the buffers in agricultural chemicals, polymer manufacturing, and pharmaceutical intermediates exhaust in the same way, the symptomatic phase begins simultaneously with the early incubation of the chains downstream of them, each wave covering more of the economy than the last.
The ~20% of global hydrocarbon flows understates the eventual footprint as the propagation through secondary and tertiary chains means the eventual economic reach is substantially larger – though how much larger depends on how far the incubation proceeds before the Strait reopens. A short closure keeps the disruption primarily in the energy layer. A closure that runs through the September inventory floor allows the secondary infections to complete their own cycles. At that point the question is no longer about hydrocarbon supply; instead, it is about the downstream industries that have been running on buffers that are now exhausted.
The financial transmission
The GFC parallel is deeper than just the load-bearing assumption point addressed in the calibration section. The physical shock collides with a financial system already carrying multiple independent vulnerabilities, as outlined in the overdetermination argument. Each is capable of extending the damage beyond what the supply disruption alone would produce. They are a tariff shock still working through global trade, a credit cycle turning after fifteen years of near-zero rates, and private credit carrying concentrated exposure to the leveraged corporate sector while earnings face downward revisions. In addition, global markets are looking at three separate liquidity withdrawals: Japan’s yield curve normalisation is pulling capital home as the Bank of Japan raises rates; GCC sovereign wealth funds are reallocating domestically as the war creates competing demands – fiscal, economic, and political – that are pulling Gulf capital homeward; and China’s slow, deliberate withdrawal from US dollar holdings has accelerated in the post-tariff environment. None of these individually constitutes a crisis. Together they represent a withdrawal of marginal demand from US debt at the moment the US fiscal position and corporate leverage are most exposed to rising interest costs.
Private credit is the closest analogue to the GFC’s daisy-chain, though the instrument is different and the gross leverage smaller. Nevertheless, the principle is the same: risk accumulated during easy conditions, held in instruments less liquid and less transparent than regulated bank loans, now confronted by real-economy deterioration that will surface defaults in a market where cross-holdings and concentrations are not visible until something fails. The GFC’s damage was amplified by opacity and the inability to price risk before failures cascaded, and private credit has both properties.
The hyperscaler free cash flow (FCF) data adds a connecting dimension because the AI capex cycle has played the role of primary support for equity sentiment throughout the disruption, hence why the market has been comfortable to price a return to normal despite the physical data suggesting otherwise. As that support erodes, though, the equity market’s acceptance of the recovery scenario will shrink, and the repricing of positions built on that assumption will accelerate. FCF across the major hyperscalers has fallen from roughly $45bn per quarter to approximately $4bn, with Meta burning cash in the second half of last year and Microsoft going negative for at least one quarter. Data centre infrastructure draws from the same Hormuz-exposed supply chains – energy inputs, polymer-based components, industrial materials – and the financial cushion to absorb cost escalation has narrowed.
The Hormuz shock does not need to cause a financial crisis on its own. It only needs to tip a system already under that weight.
No herd immunity
Reopening the Strait does not stop an epidemic that has already branched. Supply chains that have restructured around scarcity – alternative routing, reduced throughput, substitute sourcing at higher cost – do not revert to pre-closure configurations on the day the Strait reopens. Insurance markets, now at 8-15x normal war-risk premiums, reprice on demonstrated safety over time rather than on the announcement of a resolution. Inventory rebuilding from the operational floor takes months. Secondary and tertiary infections already running will continue on their own timelines, at rates that depend on the adaptive responses available to each, but independent of what has happened upstream. By the time the later infections appear in the macro data, the primary infection will have already run through the September floor. That is what the cracker margin signal has been pointing to since the first days of the closure.
The September operational floor is the date by which Goldman’s load-bearing assumption must prove correct. If the Strait is still closed in September, then everything priced on the recovery assumption reprices – and the repricing will be fast because positioning has normalised around an assumption that the physical data has been contradicting for ten weeks.
As an experienced engineer in the mathematical modeling of complex dynamic systems, I find this presentation shows clearly the dire cascading effects of the worst geopolitical economic disruption in civilization history.
And the incredibly highly leveraged derivatives speculative markets, such as credit default swaps; hasn't even been modeled!