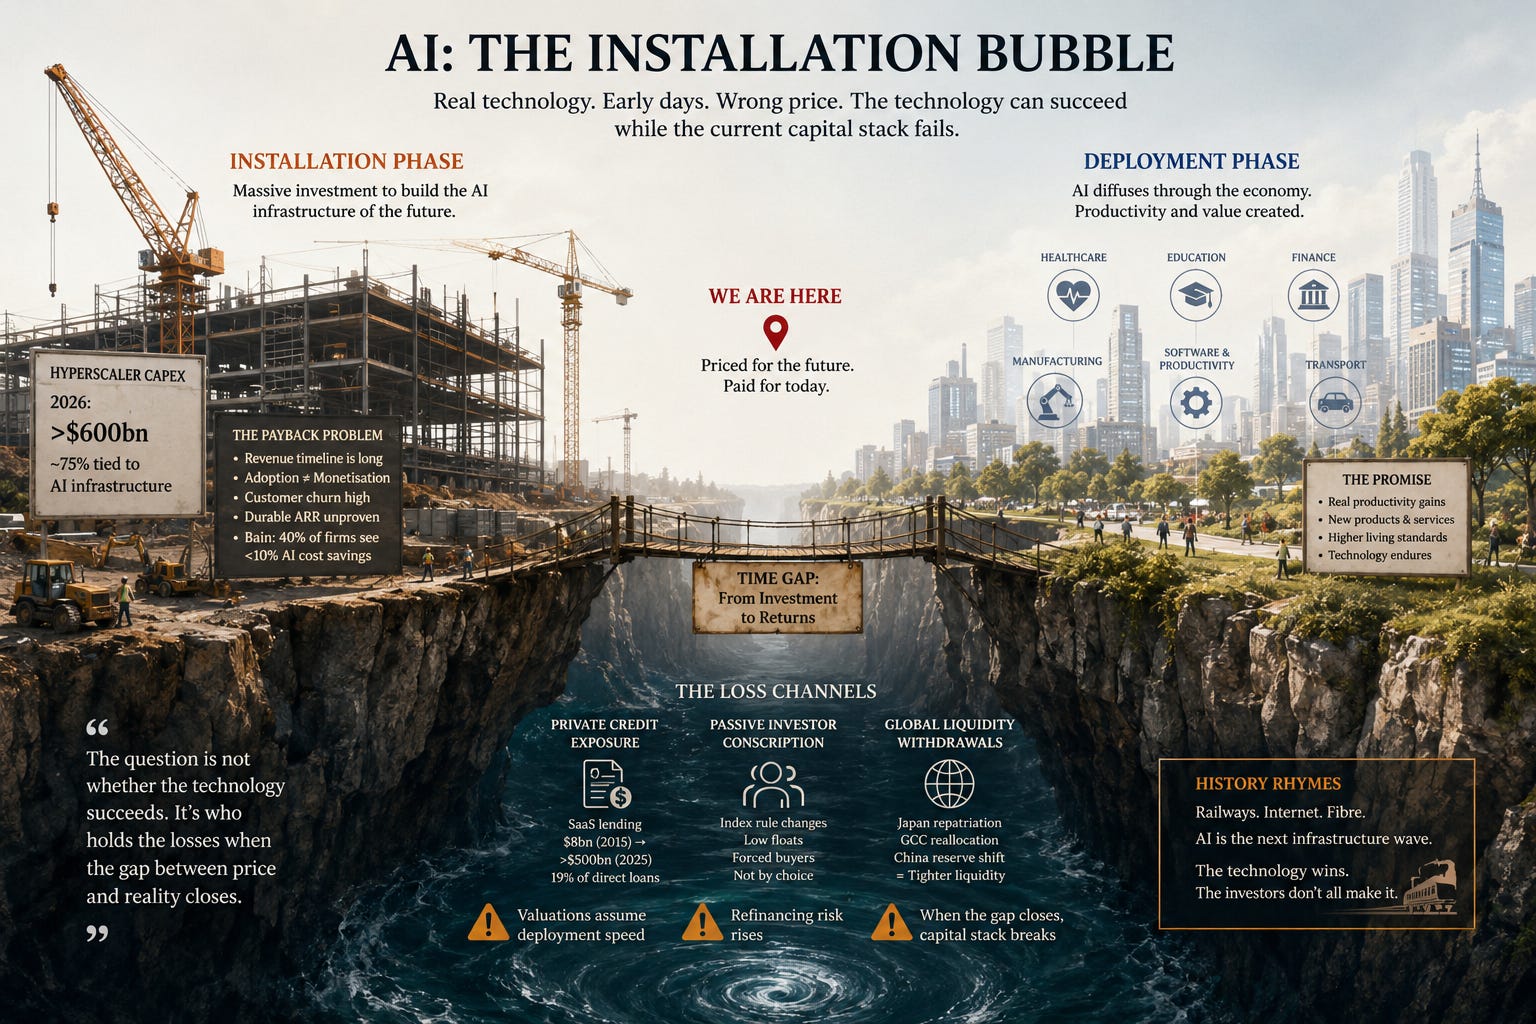
The AI Installation Bubble
Worthwhile technology endures, but capital structures often do not


The railways transformed Britain’s economy for a century, yet the investors who funded the 1840s mania lost two-thirds of their money. Similarly, the dot.com boom saw the failures of many investors, but the internet did not fail. Worthwhile technology endures even though capital structures often do not.
The technology sceptics who called AI overblown after February’s sell-off were reading collapsing valuations as evidence of collapsing technology, the same error as calling the internet finished in 2001. The boosters who respond by citing real capabilities and genuine disruption are right about the technology but wrong to think that settles the valuation question. AI will diffuse through the global economy over the coming decades in ways that exceed current imagination, yet it is also entirely consistent with most current investors losing most of their money. The argument that AI disruption is real – and that the problem is not failure but a mismatch between who captures the gains and who holds the costs – was set out in AI Is Not Failing. That’s the Problem. This piece picks up where that one left off.
Carlota Perez laid out the explanation in 2002, at the moment dot-com sceptics thought history had vindicated them. She had spent two decades studying the five major technological revolutions of the previous two centuries – railways, steel and electricity, the motor car, mass production, and the internet – and found the same pattern in each. Speculative capital funds an installation phase that builds the infrastructure. A crash follows. Then a deployment phase, where institutions adapt and the technology diffuses far more widely and powerfully than the original frenzy implied. The bubble is how the infrastructure gets funded, not proof of a failure of the technology. The fibre-optic cables and data centres that made the post-2000 internet possible were paid for by investors who lost everything on the companies that built them.
Jeremy Grantham, co-founder of GMO and one of the most closely followed bubble analysts of the past three decades – correctly calling the dot-com bust and the 2008 housing crash – calls AI “maybe the most visibly impressive innovation of the last 100 years, perhaps of a magnitude equal to the railways of the 19th century.” He also thinks it is a bubble. He is not contradicting himself. A genuine technological revolution and a speculative mania are not mutually exclusive – historically, they often appear together.
The capex-revenue gap
The bullish response to this is that today’s money is different. The hyperscalers – Amazon, Alphabet, Meta, Microsoft – are profitable companies with genuine cash flows, not the hollowed-out balance sheets of Pets.com. This is partly right, but it is becoming less right at increasing speed.
The five largest hyperscalers – adding Oracle to the four above – will spend more than $700bn on capital expenditure in 2026, roughly double 2025 levels, with approximately three-quarters tied directly to AI infrastructure. The deterioration in their aggregate free cash flow is striking: the group was generating around $45bn per quarter in free cash flow in 2024; by 1Q26 that had fallen to around $4bn. After dividends and buybacks, aggregate capex now exceeds projected free cash flow, meaning hyperscalers are beginning to borrow to fund AI investment, having previously funded it from operations. Amazon is projected to run negative free cash flow of up to $28bn in 2026, and filed with the SEC indicating it may seek to raise additional equity and debt as its build-out continues. The prisoner’s dilemma is driving this: no individual hyperscaler can safely reduce spending without risking being overtaken, so collective over-investment is guaranteed even when each participant can see the problem.
Against that investment, the revenue required to justify the infrastructure spend remains far ahead of proven, durable end-user willingness to pay. In a June 2024 piece for Sequoia Capital, partner David Cahn posed what he called “AI’s $600 Billion Question” – an update to his earlier “AI’s $200 Billion Question” from September 2023. His calculation is straightforward: take Nvidia’s data centre revenue run rate, double it for total infrastructure cost of ownership, double again for the gross margin operators need to justify the spend, and the result is the annual revenue the AI industry must generate to make the capex rational. In late 2023 that implied requirement was $200bn, and by mid-2024 it was $600bn. In 2026, with Nvidia revenue running substantially higher, the implied number is larger still, and the gap that Cahn identified two years ago has widened. In his December 2025 outlook for Sequoia, Cahn observed that end-user AI revenue remains “on the order of tens of billions per year” against infrastructure investment “on the order of trillions over the coming five years” – the same gap, but at larger scale. A 2026 Bain & Co survey reinforces the same point from the demand side: nearly 40% of companies that have measured their AI cost savings report a figure below 10%, despite having targeted reductions of 11–20%. The technology is being adopted, but it is not yet generating the enterprise productivity gains at the magnitude the investment assumes.
The revenue problem is not just about adoption rates, but also the economics of how AI is priced. The Economist explained a year ago that traditional annual recurring revenue – based on durable subscription commitments with churn below 5% – has been replaced in AI by what one venture capitalist called “experimental run rate”: customers experimenting enthusiastically but not committing durably, with churn above 20% in many products. The revenue growth is there, but its durability is untested and its current valuations assume it is more durable than it is.
Whether this is a bubble in the statistical sense is more complicated
Amundi’s Investment Institute – the research arm of Europe’s largest asset manager – ran a formal test. They constructed AI and non-AI portfolios from the S&P 500 and applied the autoregressive bubble detection methodology used in the academic literature, testing whether P/E ratios show the explosive non-stationary dynamics that characterised dot-com valuations from 1997 to 2000, the mathematical signature of a true speculative bubble. Their conclusion, published in April 2026, was that the current AI episode does not exhibit those dynamics. AI stocks’ P/E ratios have been falling from 2023 to 2025 despite strong price appreciation, because earnings growth has outpaced price gains. During the dot-com period, P/E ratios in TMT (Technology, Media and Telecommunications) expanded continuously and the statistical test found the signature of a genuine bubble. For AI stocks through end-2025, the same test found no such pattern.
This piece calls it a bubble anyway, and that needs explaining. The Amundi finding applies to established AI stocks in the public market through 2025. What this piece focuses on is the capital structure – the gap between installation-phase investment and deployment-phase returns – not a claim that every AI stock is statistically overvalued right now. The risk Amundi identifies reinforces rather than contradicts this: concentration, not speculative excess in the classic sense. At peak, 45 stocks held a 38.2% index weight, with average individual stock weights nearly double those of the dot-com TMT basket. A narrow group of companies has driven a disproportionate share of returns, and Amundi’s own comparison of the AI portfolio’s performance with the 1997–99 TMT trajectory – the takeoff and exuberance phases of the dot-com cycle – is a warning about where the cycle may be heading even if it has not yet shown explosive characteristics in the public market.
What the Amundi analysis cannot assess is the private market, where The Economist’s “vibe valuing” operates – Mira Murati’s startup at $10bn before it had a strategy, Perplexity at 400 times revenue, OpenAI burning several billion dollars annually while valued at more than $800bn. The public market through 2025 was pricing real earnings. The private market has been operating on different assumptions entirely, and the 2026 IPO wave is what brings those assumptions into public markets at scale.
SpaceX and the Odlyzko problem
SpaceX, Anthropic, and OpenAI are all now moving toward public markets simultaneously, at combined implied valuations approaching $3.5tn. None is profitable. Goldman Sachs – as lead underwriter earning its fee when the SpaceX deal closes at the highest possible price – projects that the xAI division will grow revenue from $3.2bn to $322bn by 2030, while SpaceX total revenue rises from $18.7bn to $474bn over the same period. That is a bold growth assumption to say the least. It is more accurate to say it is a market-share reversal assumption: as Morningstar’s own analysis of the S-1 notes, to justify the Goldman projections Grok would need to surpass Anthropic, Google, and OpenAI in coding, cybersecurity, agents, and chatbots from a current position of competitive inferiority. Morningstar puts SpaceX’s fair value at $780bn, less than half the $1.75tn IPO target. A revealing analysis on X, applying comparable market multiples to each of SpaceX’s three business segments independently, arrives at $550bn, a different methodology converging on roughly the same territory. The gap between those two disciplined estimates and the IPO price is not a rounding error.
The TAM (Total Addressable Market – the total potential revenue available to the business) claim that anchors the valuation needs a brief mention. SpaceX’s prospectus identifies a TAM of $28.5tn – larger than any economy on earth except the United States. Less than $2tn of that figure is attributed to space and satellites, the business SpaceX actually operates. The remaining $26.5tn is AI. The word “AI” appears 1,251 times in the prospectus. “Multiplanetary” appears 18 times.
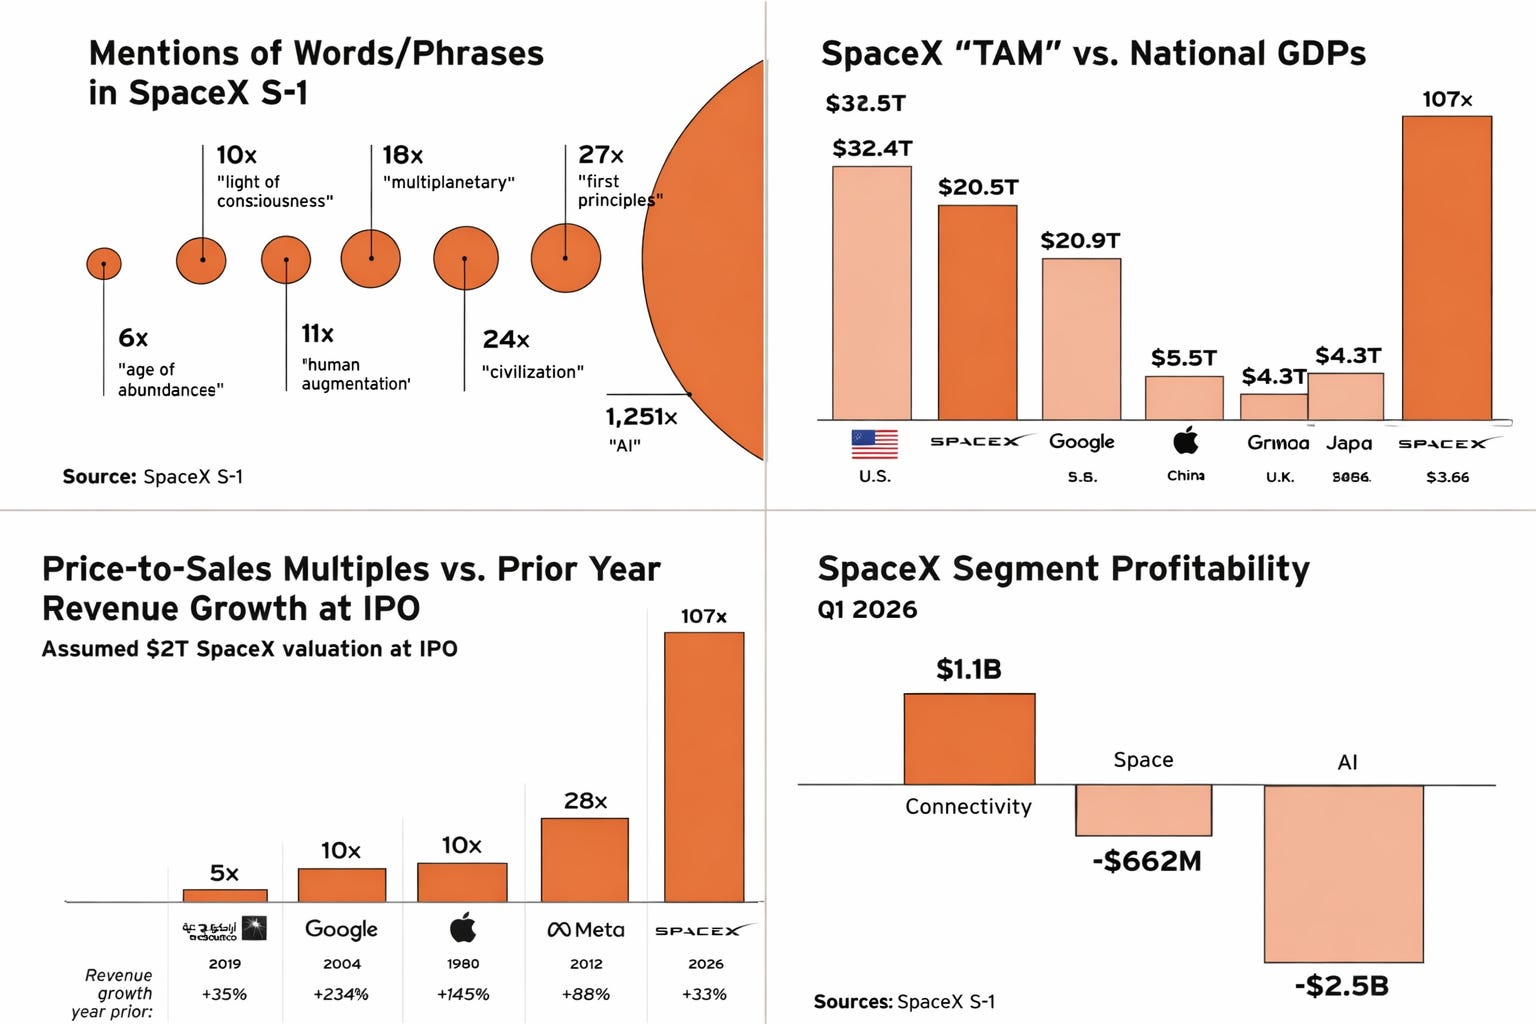
The S-1 filed on 20 May 2026 sets out the trajectory in detail. In 2024, SpaceX was profitable at $791m net income, but that was prior to the xAI acquisition which changed it overnight: xAI recorded a $6.35bn operating loss in 2025 on $3.2bn in revenue, an operating margin of minus 200%. In 1Q26 alone, xAI posted $818m in revenue and a $2.47bn operating loss — an annualised margin of minus 302%. Scaling appears to be making the economics worse, not better. As PitchBook senior research analyst Harrison Rolfes put it: “If you compare xAI to a traditional SaaS company – cloud-based software delivered by subscription – the financials look reckless. If that payoff doesn’t happen, we are looking at the largest venture-funded correction in history.”
Andrew Odlyzko, a mathematician and financial historian at the University of Minnesota, whose research on the British Railway Mania is the standard academic reference on the subject, found that a contemporary calculation showed the 8,000 miles of newly authorised British railways would require passenger traffic to increase fivefold within five years from an existing base of 34 million to deliver their projected 10% return. Odlyzko noted that this calculation “should have alarmed observers by itself”, but collective psychology distracted attention from it. The Goldman xAI projection is the equivalent calculation, stated boldly rather than hidden in the SpaceX prospectus, and the index inclusion mechanism now ensures it is priced by passive investors whether or not any individual investor has read it.
A further detail worth noting: Anthropic – simultaneously filing for its own IPO at a $965bn valuation – is SpaceX’s largest disclosed revenue customer, paying $1.25bn per month for compute capacity through May 2029 under a contract either party can terminate on 90 days’ notice. Goldman’s projections for xAI revenue are thus partly dependent on a contract held by a company that itself has no confirmed path to profitability. The Goldman projections require multiple things to go right simultaneously, in the same period that the broader macro environment is deteriorating. Readers familiar with the overdetermined downturn argument – that the optimist needs every causal chain to resolve at once – will recognise the structure.
The index rules and the conscription problem
Index investing is sold as neutral exposure to the market. When index providers alter entry rules for giant, low-float, newly listed companies, then passive investors become exit liquidity, the buyers who allow early investors to exit at IPO pricing, without having chosen to participate in the valuation themselves.
S&P Dow Jones announced on 5 June that it would not change its eligibility requirements, explicitly holding the four-quarter GAAP profitability requirement in place, stating that “exceptions to the financial viability, seasoning, and investable weight factor requirements should not be granted solely based on market capitalisation.” SpaceX posted a net loss of $4.94bn for full-year 2025, and a further $4.28bn in 1Q26 alone, leaving its earliest possible S&P 500 eligibility at mid-2027 at the earliest, and only if it achieves profitability. S&P held the line, but Nasdaq and FTSE Russell did not.
Nasdaq’s Fast Entry rule, effective May 2026, allows companies ranked in the top 40 by market cap to join the Nasdaq-100 within 15 trading days of listing, down from a prior three-month minimum. The minimum float requirement has been eliminated, though companies receive a lower index weighting until more shares are available for trading. FTSE Russell shortened its window to five trading days. It was reported that SpaceX advisers were in discussions with index providers about accelerated inclusion earlier in the year, and the rule changes at both Nasdaq and FTSE Russell followed.
The passive-buying story is therefore a Nasdaq-100, Russell 1000, and FTSE story – not an S&P 500 story, for now – but it is still substantial. Around $527bn tracked the Nasdaq-100 at end of 2025, and with SpaceX floating only 3-5% of its total shares, the mechanical demand concentrated into that thin float will be significant. Bloomberg Intelligence estimated that fast S&P 500 inclusion alone would have triggered $14bn in forced passive buying for SpaceX – Nasdaq-100 and Russell inclusion will produce their own comparable flows. Every Australian superannuation member with US equity index exposure, every UK pension holder with global equity allocation, every US 401(k) holder in a total-market fund is being enrolled in this valuation without having chosen it. Anthropic is reported to be targeting a $965bn valuation in a confidential IPO filing and OpenAI is expected to follow in Q4. The index conscription problem for SpaceX is the floor of what this IPO wave produces, not the ceiling.
The Amundi concentration warning and the index rule rewrites are the same problem crystallising from different angles. Through 2025, investors at least chose their AI exposure, but from 2026, much of it is assigned to them. The distinction between markets as measurement and markets as mechanism – explored in Equity Markets: The Thermometer That is Mistaken for a Thermostat – is what the index rule rewrites collapse. When passive buying is mechanically triggered by index weight, the market stops measuring and starts directing.
The private credit channel
The part of this story receiving the least attention carries the most direct implications for the broader economy, and it connects directly to the three withdrawals argument developed earlier.
Outstanding loans to SaaS firms – cloud-based software companies delivering services by subscription, which for a decade represented some of the most stable and predictable cash flows in the private credit market – rose from around $8bn in 2015 to more than $500bn, equal to 19% of all direct loans, by end-2025, according to the Bank for International Settlements. The thesis underwriting those loans was stability: sticky recurring revenue, high gross margins, predictable cash flows, and low churn. For a decade, it was sound, but AI is now eroding those specific characteristics. The BIS’s March 2026 Quarterly Review found that software stocks fell almost 30% between October 2025 and February 2026, and that BDCs (Business Development Companies – specialised investment vehicles that provide direct loans to small and mid-sized businesses) with higher SaaS exposure underperformed peers by around 5 percentage points over the same period. Discounts to NAV (Net Asset Value) deepened, signalling concerns that the book value of illiquid private loans no longer reflects realisable values.
UBS has estimated $75–120bn in fresh defaults across leveraged loans and private credit by year-end 2026, driven by AI disruption of software borrowers. TPG’s co-managing partner has stated where the exposure is concentrated: portfolios underwritten in 2018–2020, before generative AI, carry the highest vulnerability. Those loans were written against cash flows that AI is now repricing downward, meaning the capex that is building the AI infrastructure is also destroying the revenue streams that backed the debt that financed the software buyouts. Industry-wide redemption requests spiked in late 2025 and early 2026, with several large non-traded BDCs and interval funds capping or slowing withdrawals.
Oliver Wyman drew the 2008 parallel: in 2008, banks discovered they owned far more US housing risk than their internal reports suggested, because exposures were distributed across multiple book categories that did not appear as mortgage risk in standard credit reporting. AI-related credit exposure is distributed similarly across corporate, real estate, infrastructure, fund financing, and alternative credit books, and thus may not appear as technology risk until it fails.
Where the three liquidity withdrawals tighten the vice
The Oliver Wyman and BIS analyses both assume relatively normal global liquidity conditions. They do not price the three withdrawals running simultaneously: Japanese repatriation driven by rising domestic yields as the Bank of Japan normalises policy, GCC (Gulf Cooperation Council) sovereign wealth fund (SWF) redirection toward domestic priorities as reconstruction and defence spending pull capital inward, and China’s structural reduction in US Treasury holdings as a function of reserve diversification and sanctions risk management.
The withdrawals operate through both the Treasury market and the US private asset ecosystem – private equity, venture capital, real estate, and credit funds. Gulf SWF redirection does not mean only selling Treasuries; it also means reducing allocations to the US private capital pool that has been funding leveraged buyouts, growth equity, and the software sector buyouts described above. Remove that patient capital from the investor base of large alternative managers and the refinancing extension model that has been keeping the private credit slow cycle functioning becomes harder to sustain. A State Street survey of SWF allocations published in March 2026 confirmed that SWFs have been systematically reducing fixed income allocations and redeploying into private markets, digital infrastructure, and AI – meaning the same capital withdrawing from one part of the ecosystem is partly inflating valuations in another.
Each of the three global liquidity withdrawals independently compresses global dollar liquidity. Running together, they tighten the refinancing environment for stressed software borrowers at the time when AI disruption is hitting their cash flows and the maturity wall for 2018–2020 vintage software debt is approaching – an estimated $620bn due through 2027. If the refinancing window narrows through external liquidity compression at the same time that AI-driven cash flow deterioration is reducing borrowers’ debt-servicing capacity, the defaults UBS is projecting are a floor, not a ceiling.
Harvard economist Jason Furman calculated that AI-driven infrastructure investment accounted for 92% of US GDP growth in the first half of 2025, and that excluding these technology-related categories, annualised GDP growth would have been just 0.1%. This pattern has held into 2026, with software and IT equipment investment contributing 67% of 1Q26 GDP growth of 2.0%, meaning the non-AI economy was growing at roughly 0.7% annualised. A slowdown in AI capex does not stay inside the technology sector. It reverses a contribution that has been carrying a disproportionate share of headline growth, concurrently with tariff uncertainty, China’s structural drag, the credit cycle position, and the oil price and hydrocarbon shocks from the Strait of Hormuz. The overdetermined downturn argument must now incorporate the AI capex cycle as one of the causal chains, and if it turns, the optimist needs everything else to resolve simultaneously.
The technology will exceed current expectations over coming decades. The Perez framework, the historical precedent, and the genuine capabilities already being demonstrated all point the same way. What the railways built in the 1840s, what the internet built in the 1990s, and what AI is building now is infrastructure that the deployment phase will use long after the installation-phase investors are gone. The question over the medium term – say, three to seven years – is not whether the technology succeeds, but who holds the losses when the gap between the Goldman projections and the reachable revenue closes, and through which channels those losses travel into the parts of the financial system that have nothing to do with AI.
Postscript – 8 June 2026
The article above was finalised as SpaceX’s IPO roadshow was under way, with pricing expected after market close on 11 June. Friday 5 June’s session produced a useful preview of the argument in action.
The S&P 500 fell 2.6% on 5 June, its worst day since October, with the Nasdaq down 4.2%, its worst single session since April 2025. Among the heaviest falls were Nvidia down 6.2%, Broadcom nearly 8%, and Micron more than 13%. The VIX (the market’s volatility gauge) surged 40% to its highest level in two months. South Korea’s tech-heavy market fell 5.5%. The immediate trigger was a May jobs report that came in roughly double expectations – 172,000 against an 80,000 forecast – which pushed bond yields higher and revived expectations of Federal Reserve rate rises.
The apparent contradiction in the mechanism is worth noting. Good economic news produced a technology sell-off because strong employment data threatens the rate environment on which elevated AI valuations depend. The argument for current multiples requires, among other things, that monetary conditions remain loose enough to support long-duration growth assets at these prices. A labour market running well above expectations at this point of the cycle – with energy costs from the Hormuz disruption already feeding into inflation – makes that assumption harder to sustain. This is the monetary trap described in Markets and Economists Are Both Right About Rates: the supply constraint does not ease when demand weakens, so central banks face deteriorating growth and still-elevated prices simultaneously.
This is not a crash. Briefing.com’s Patrick O’Hare explained the market’s own reading: “Everyone’s realising that perhaps this rally off the March lows has run its course for the time being.” What Friday showed is that the AI valuation complex is simultaneously rate-sensitive and narrow enough that a single day’s selling in a handful of semiconductor names can produce the S&P 500’s worst week in ten. That is the concentration risk the Amundi paper identified, observed in real time.