
Pricing the Press Release
The elasticity arithmetic the market ignores each time a deal is announced

The market has a simple model of this conflict: a deal means Hormuz opens and Hormuz opening means oil prices fall toward pre-war levels. Both halves of that equation are wrong, and the events of 23-24 May demonstrated the error across 48 hours in compressed form.
On Saturday 23 May, Donald Trump announced that a deal had been “largely negotiated” and would be announced shortly. Oil prices fell. By late Saturday the terms had leaked, revealing that the two sides were describing different agreements – Iran’s version required $370 billion in upfront US concessions, full Iranian sovereignty over the Strait, and zero nuclear commitments before a 60-day negotiation period could begin, while the US version included nuclear commitments and deferred sanctions relief. An unnamed White House official said the deal was “95% done”. Yet, the remaining 5% turned out to be about 95% of the issues neither side can agree on. By Sunday, Trump was posting bomb imagery on Truth Social under reported pressure from Israel and domestic hawks, Iran declared the agreement “completely cancelled” due to US obstruction, and the deal that never existed was publicly collapsing.
The pattern is now on its eighth iteration since March. Each de-escalatory signal produces a price decline; the physical draw on global inventories continues regardless; the strait remains effectively closed to most commercial shipping; and within hours or days the price recovers. The market has learned nothing from the previous seven cycles, and the reason is that it keeps pricing the press release not the number of barrels in transit.
What it should be pricing is the arithmetic of physical shortage, and that arithmetic produces oil prices well above current levels under every scenario available, including the most optimistic one. The deal on the table, such as it was, placed us in the exit scenario at best, and the physical ramp back to pre-war oil flows takes months, not days, even under immediate resolution.
The physical picture first. Before the conflict, the Strait of Hormuz carried roughly 20 million barrels per day of crude oil and petroleum products – about 20% of global consumption which the IEA put at just over 103 mb/d in early 2026. There are bypass routes, but they are limited. Saudi Arabia’s East-West Petroline and the UAE’s Abu Dhabi Crude Oil Pipeline together offer an estimated 3.5 to 5.5 mb/d of capacity – operational infrastructure built specifically for this scenario, currently running below capacity, but with ramp-up constrained by Red Sea terminal logistics and tanker repositioning rather than pipeline readiness. Iraq’s Kirkuk-Ceyhan route adds some additional volume, though it carries uncertainty given its history of political and operational disruptions. Four countries have no bypass infrastructure at all: Iran, Kuwait, Qatar, and Bahrain. A generous estimate has bypass absorbing 5-7 mb/d of the gap, leaving a shortfall of roughly 13-15 mb/d, or 12-15% of global consumption. The IEA called it the largest supply disruption in the history of the global oil market.
The natural response is that higher prices will destroy enough demand to clear the market – the orthodox solution economists reach for when supply falls short. This is correct as far as it goes, but it goes less far than usually assumed when the supply shock is large enough, and oil demand is extraordinarily inelastic in the short run.
Price elasticity of demand measures how much quantity demanded falls for a given rise in price, with a value of -1.0 meaning a 10 per cent price rise reduces demand by 10%. Oil is nowhere near that. The price elasticity of US demand for oil is often estimated to be around -0.05 in the short run. The Federal Reserve’s survey of thirty academic studies puts the consensus short-run demand elasticity at -0.13, with estimates ranging from -0.03 to -0.30. James Hamilton’s widely cited work finds the implied elasticity in the 1979-81 episode at around -0.21, and notes that more recent studies suggest demand has become even less responsive to price, somewhere between -0.034 and -0.077 for the 2001-06 period.
The reason is that the bulk of oil demand is captive. Industrial feedstocks, freight, aviation, and power generation in markets without immediate alternatives cannot reduce consumption in response to price within any relevant short-run timeframe. The slice that actually responds – discretionary driving, some industrial substitution, efficiency switching – is a small fraction of total demand, so price has to rise very far to destroy enough of it to balance the market.
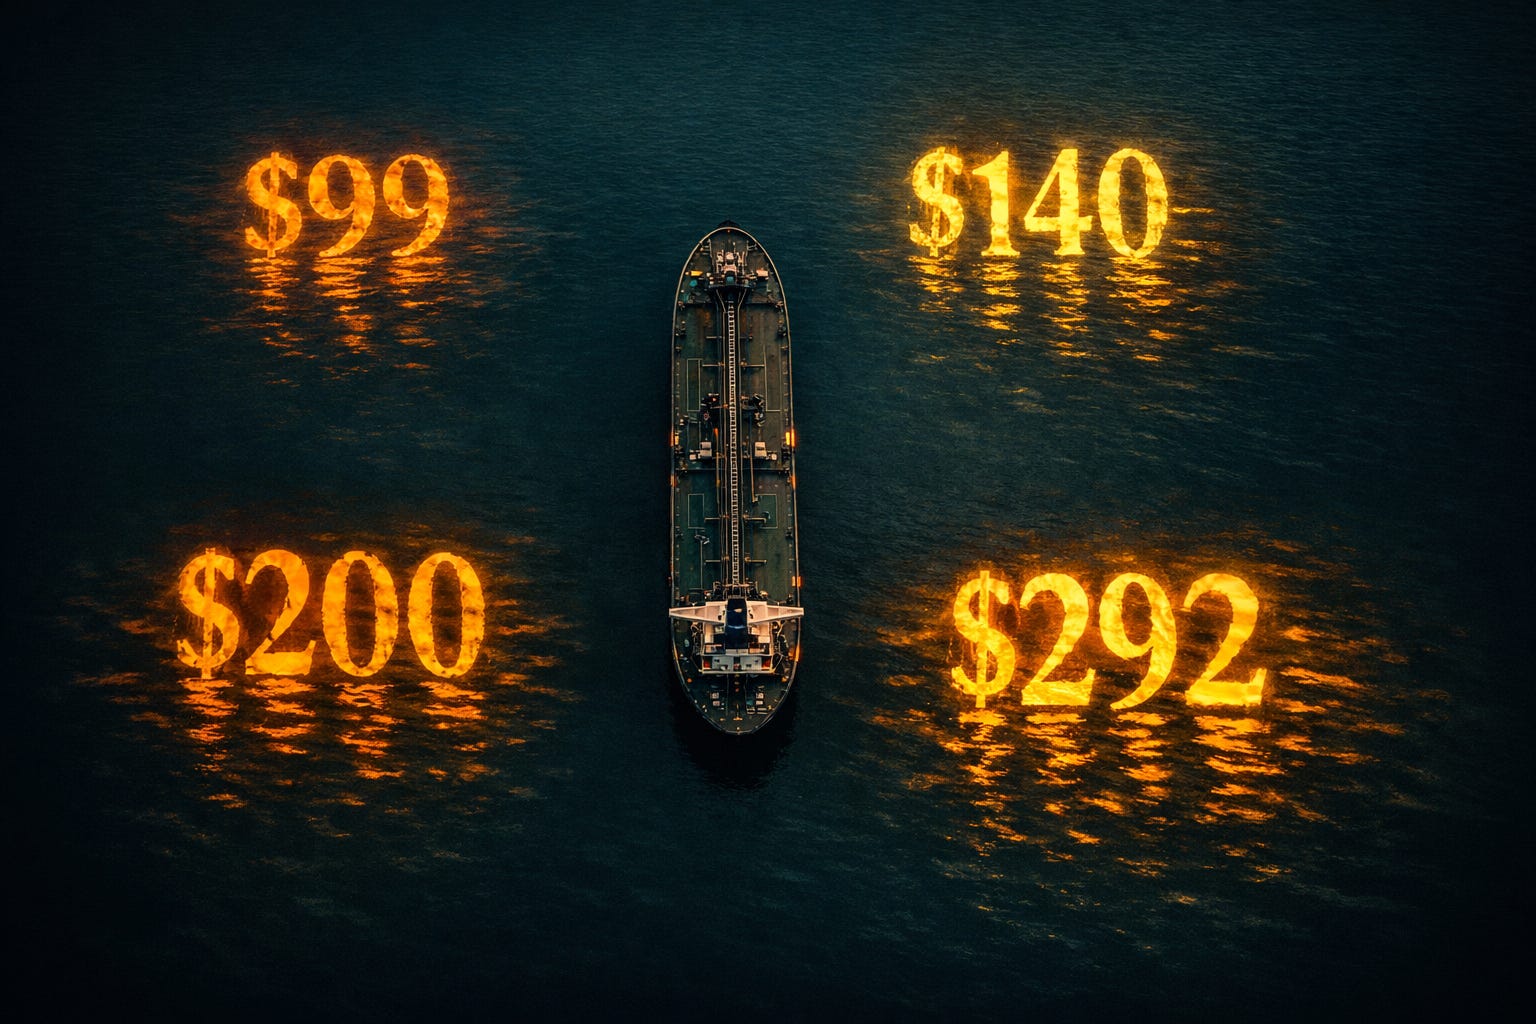
The required price increase depends on which elasticity estimate applies. At the upper bound of -0.21 – the most responsive demand scenario – a 12-15% shortfall requires a price rise of 57-71% from the pre-war $69, producing a clearing price of approximately $108-118. At the consensus of -0.13, the required rise is 92-115%, producing approximately $133-149. At the lower estimate of -0.05 – the most inelastic scenario – the required rise is 240-300%, producing approximately $235-276. The arithmetic therefore establishes a clearing price range of roughly $108 to $276, with the consensus pointing to approximately $133-150.
Demand destruction works as a market-clearing mechanism when the shortfall is modest. A 2-3% supply reduction requires a proportionally modest price increase, demand falls by the required amount, and the economy adjusts to a new stable price level. The adjustment is painful but contained. A 12-15% shortfall requires something categorically different. The clearing prices that the arithmetic produces are theoretical under standard assumptions – they model what price would balance supply and demand if demand could fall smoothly down the elasticity curve. In practice, at these price levels, the demand being destroyed is not discretionary spending that households choose to reduce but economic activity that ceases to be viable: industrial processes cannot absorb energy costs that have doubled or tripled, airlines cannot cover fuel costs at fares passengers will pay, and agricultural supply chains dependent on diesel and fertiliser become uneconomic. Supply does not recover during this process – full pre-war flows remain many months away even under immediate resolution, and while demand destruction is eliminating economic infrastructure month by month, the physical shortage persists.
The analogy is with the difference between a common virus and Ebola. In a mild infection, the immune response contains the pathogen before organ damage becomes irreversible. In Ebola, the virus destroys organs faster than the immune system can respond – eventually so many organs are destroyed that the virus has nowhere left to replicate and dies, but by that time the damage is catastrophic and much of it permanent. A 12-15% supply shock is not a mild infection that the demand-destruction mechanism resolves cleanly. The price levels that would theoretically clear the market are price levels at which the economy is already in serious difficulty. The cure and the disease become indistinguishable.
The historical record illustrates that relationship between oil price and demand. In October 1973, the Arab oil embargo removed approximately 4.5 mb/d – around 7% of world consumption at the time. The price of oil went from $2.90 to $11.65 by January 1974, a near-quadrupling. In 1979, the Iranian Revolution removed a slightly lower share of global supply, and prices more than doubled over 1979-80, from around $13 to over $35 per barrel. Both episodes resulted in dire economic conditions and stagflation lasting nearly a decade, yet both removed less supply, as a share of global consumption, than the current Hormuz closure removes after bypass. They generated price responses that look extreme relative to the percentage of supply removed because inelastic demand means small shortfalls produce large price moves. The difference today is the existence of strategic reserves and bypass routes, which moderate the immediate price response relative to those episodes, but do not change the underlying clearing price implied by a supply removal that is proportionally larger.
There are short-term offsets that are currently suppressing the price below the arithmetic range. The IEA’s coordinated release of 400 million barrels from strategic reserves amounts to roughly 6-7 mb/d of additional supply spread over two months – meaningful, but finite and non-renewable at scale. OPEC+ pledged 206,000 barrels per day of additional output, less than 2% of the shortfall. US shale can respond but on a 6-12 month lag. Strategic reserves exist to cover weeks to months of disruption, but not to change the fundamental clearing price if the physical shortage persists – they buy time but do not restore equilibrium.
The scenarios already set out distribute across the arithmetic range based on duration and the degree to which supply recovery supplements demand destruction as the market clears.
The most favourable exit path, with Hormuz reopening by June or July and supply beginning to recover, sits at the optimistic end of the arithmetic range at $120-160 – well above where the market trades when it prices a deal. The resolution premium that pushed prices down to $99 on Saturday was pricing pre-war conditions, not exit-scenario conditions. Sultan Al Jaber, CEO of ADNOC, confirmed that even this path does not restore full pre-war flows until Q1 or Q2 2027, and that it would take at least four months to return oil flow to 80% of pre-war levels. A June announcement produces approximately 20 mb/d of flow by November, still 5 mb/d short of the pre-war baseline, with the global inventory rebuild adding demand against still-constrained supply through the second half of the year.
The middle path, with no full opening until late July or August, and resumption gradual rather than clean, falls above the consensus at $180-240 – consistent with elasticities at the pessimistic end of the range as demand destruction carries more of the clearing burden for longer, and financial amplification adds a risk premium on top of physical scarcity. The middle path remains the base case as of 25 May: the MOU is unsigned, the core disputes are unchanged, and the 60-day framework, even if agreed, defers rather than resolves the questions on which the physical constraint depends.
The worst path – closure persisting into the second half of the year, with Houthi activation of Bab el-Mandeb, attacks on submarine internet cables, and sustained strikes against Gulf energy infrastructure – reaches the lower bound of the arithmetic range and beyond it at $260-320, consistent with the lower -0.05 elasticity estimate plus financial amplification on top of physical scarcity.
The deal on the table, such as it is, places us in the exit scenario at best, and only if signed – which as of today it has not been. Sultan Al Jaber’s timeline runs to Q1/Q2 2027 from whenever a deal is actually signed. The 60-day nuclear negotiation period defers the question both sides describe as non-negotiable. The resolution premium that drove prices down on Saturday was pricing a restoration of pre-war conditions that no available deal actually delivers, which is why the market has been consistently wrong in both directions throughout – falling too far on deal signals and recovering too little when those signals dissolve.
Great analysis as always. Things are going to get very rocky in the next few months.