
Reading the Spread – Contango Is Not a Diagnosis
Brent flipped to contango and the market called it a surplus, but vessel data, crack spreads, and inventory buffers say otherwise

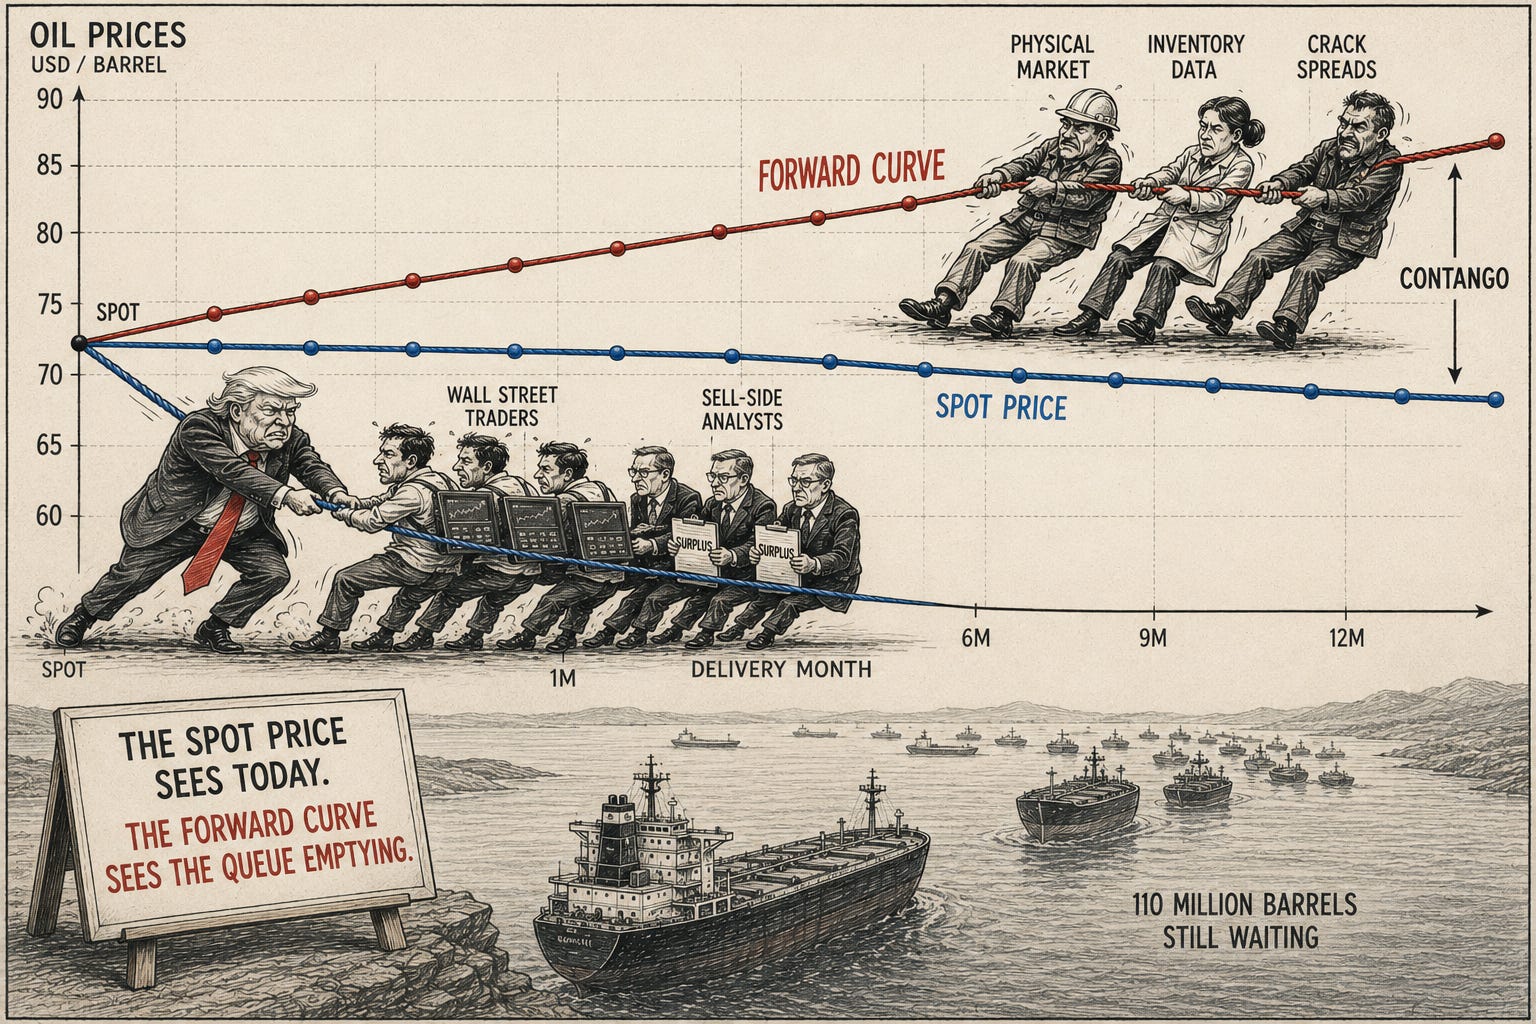
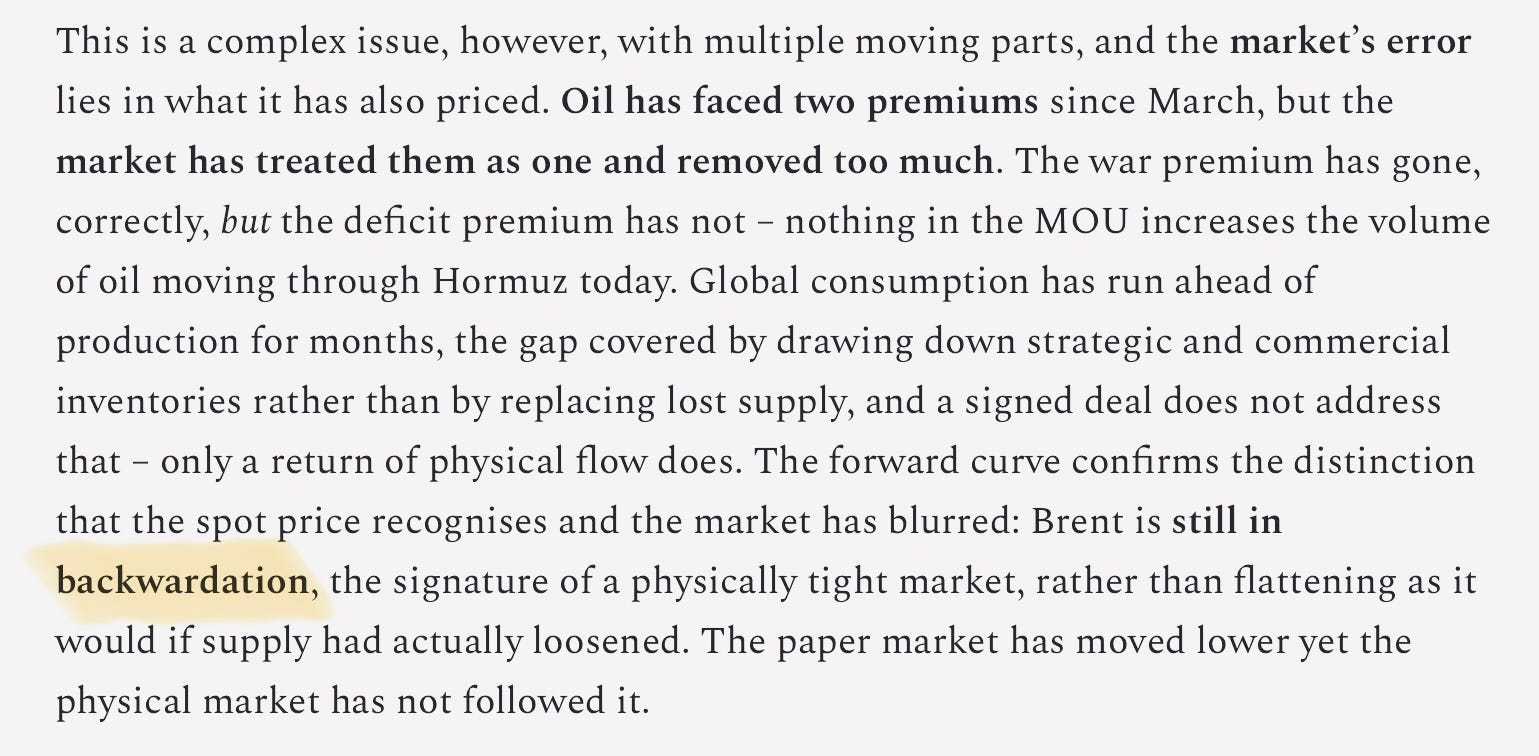
There is a law – Murphy’s is the one usually cited, though the universe operates several variants – that guarantees the market will move against you the moment you publish. I spent the better part of this week calibrating Ending the War on Paper, arguing that Brent’s forward curve remained in backwardation, the physical market’s signal that the deficit premium had not gone away whatever the paper market was doing, and that the wave was still coming. Within an hour of publication, the curve flipped to contango.
For readers who don’t follow the mechanics of futures markets, backwardation means prompt crude costs more than future delivery – the signature of a market short of supply right now, as it has been virtually since the war began. Contango is the reverse, with future delivery costing more than prompt, and it conventionally signals that near-term supply is ample, storage is filling, and the price decline reflects fundamentals rather than sentiment. If contango is the right interpretation, the market has correctly priced a surplus, the wave has been cancelled by the flood, and my argument is wrong.
So is it?
Markets are not the font of all knowledge, and price is evidence rather than verdict. We have seen this in enough bubbles and dislocations – episodes where price and underlying reality diverged for long enough to destroy people on the right side of the argument – to appreciate the distinction. Keynes observed that the market can remain irrational longer than you can remain solvent, a point that Christian Bale’s character in The Big Short came uncomfortably close to proving. It is a reason for humility about timing rather than a reason to abandon the analysis. The question is which fundamentals the price is reflecting, and whether those are the ones that determine where oil goes from here.
Two conditions, one signal
Contango can arise from two very different conditions. The first is oversupply across the whole system: inventories building everywhere, buyers with ample stock, sellers unable to clear at spot without discounting into full tanks on every continent. The second is a localised bottleneck – barrels accumulating faster at a specific point in the delivery chain than the receiving infrastructure can absorb, forcing sellers to discount to find the few buyers with space left, even as the wider balance remains tight. On a spread screen the two look the same, but they are not as one is persistent and the other is temporary.
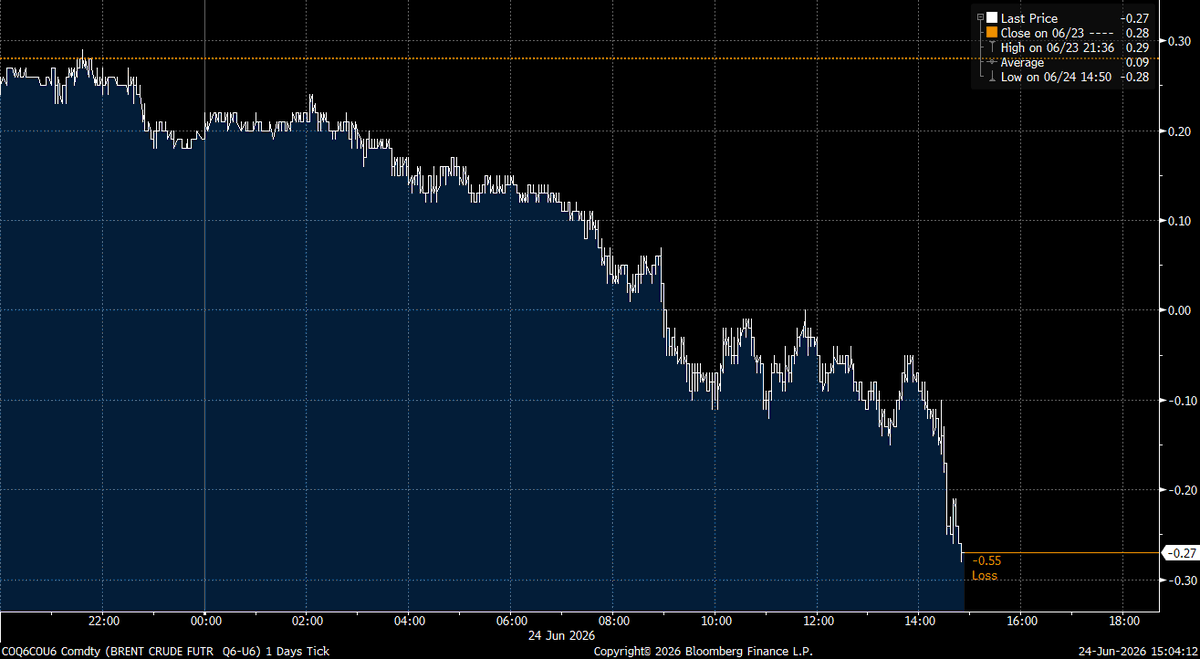
Source: https://x.com/LVision_Trading
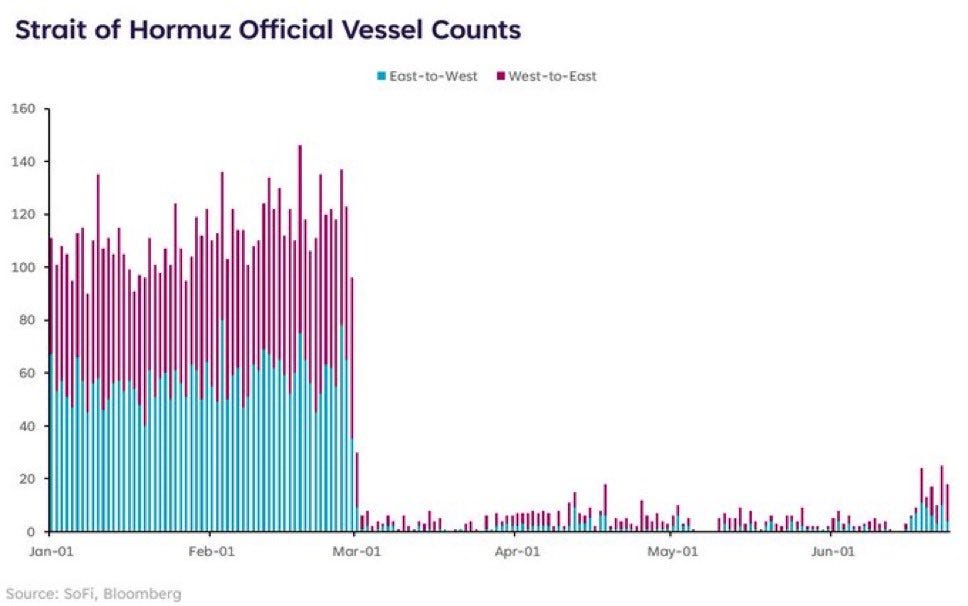
What has happened at Hormuz over the past week is the second condition – the temporary one – and the vessel data shows why. Flows through the Strait since the MOU have reached 10-15 mb/d, and the market has read that as normalisation, but it is not. Those flows are overwhelmingly pre-loaded vessels clearing a backlog, reflecting only the safe passage they needed, not restored production or refilled loading cycles.
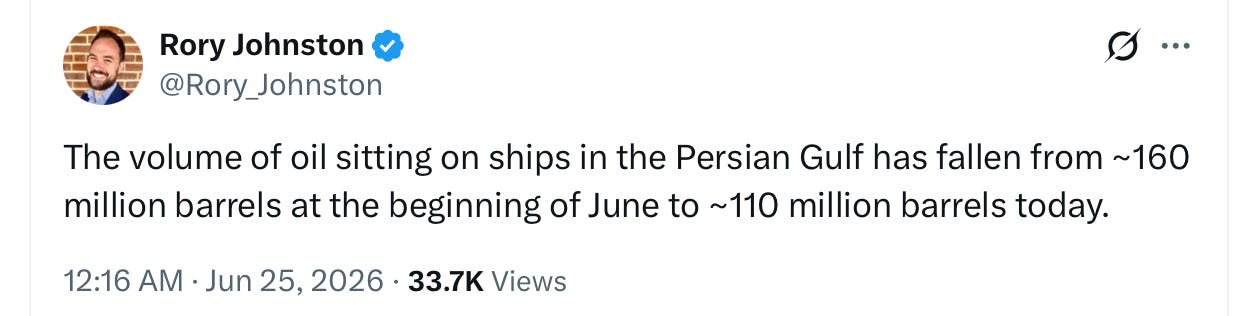
Gulf loadings are the crucial variable to monitor. Ballast entries into the Gulf, the leading indicator for new cargo capacity, fell from 20-30 mb/d equivalent in February to near zero through March and May, and have only begun recovering toward 5-6 mb/d on a 10-day rolling average. Roughly 160 million barrels were sitting on ships in the Persian Gulf at the start of June and around 110 million remained as of 25 June. When that floating storage empties – weeks away at current clearing rates – fresh loadings at sub-6 mb/d cannot sustain anything approaching current throughput. The market is watching a queue drain and erroneously calling it a recovery.
Commercial transits on a 24-hour rolling basis stood at 44 as of the evening of 24 June, against a pre-war baseline consistently above 120. A VLCC booked this week for the Persian Gulf–India route cleared at 897 Worldscale, nearly nine times the benchmark rate, the highest of the year. Those numbers are difficult to reconcile with a clean global-surplus story, but they are consistent with vessel shortage and congestion at the exit end of a waterway shut for four months. Hull war insurance premiums have fallen from around 5% of vessel value to around 2% over the past six days, a reduction in perceived risk – though at still roughly five to ten times pre-war levels, 2% signals a waterway in transition rather than one that has normalised.
Asian refiners have spent recent months sourcing replacement crude from the US, West Africa, and Russia, booking forward under term arrangements to cover the shortfall. By the time the MOU was signed, they were covered through August, so their forward purchase programmes are now full, even though global inventories are not. The flood of Gulf barrels now exiting Hormuz is therefore coinciding with a market that currently cannot absorb prompt deliveries quickly, however willing it might be to take September cargoes. Sellers need to move these barrels quickly, and with producers across the Gulf competing for the same buyers, the only lever is price, so they discount. But the discount reflects a shortage of available tank space and unfilled delivery slots, not a shortage of demand for oil. A buyer willing to take a September cargo would pay close to full price, but a buyer being asked to take a barrel now, into tanks recently filled, needs to be compensated. That inconvenience discount is a logistics price, not a market-clearing one.
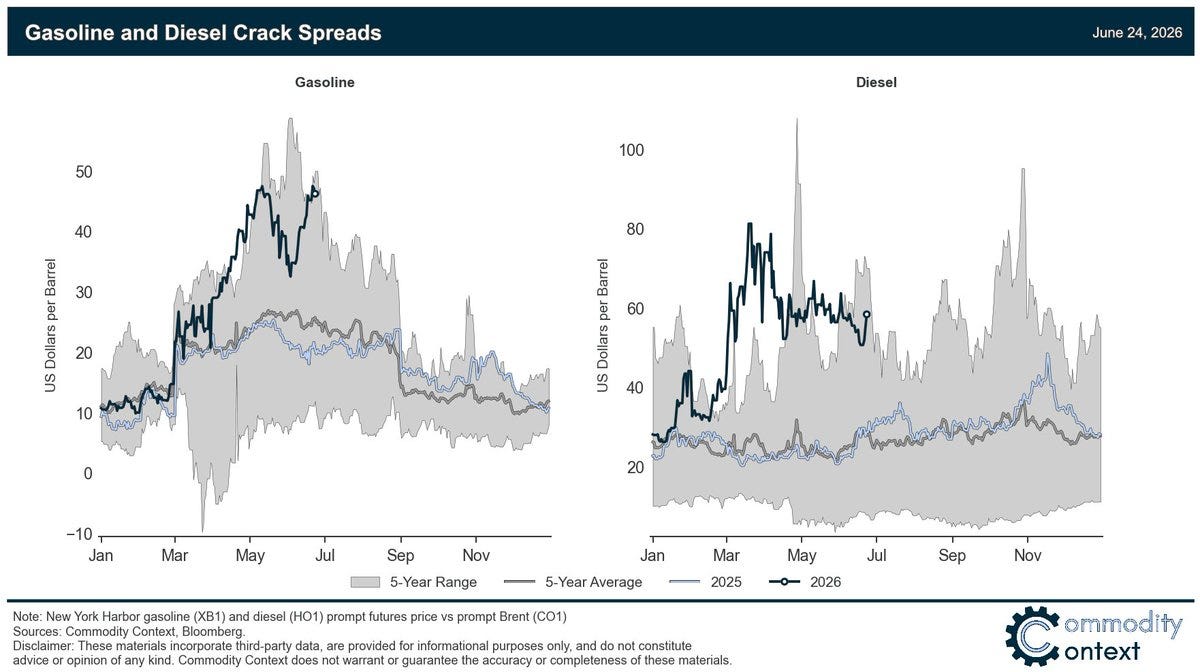
The crack spread data confirms the same argument from the refinery end. With contango, discounts, and Brent below $74, crude appears weak, yet refined products are not. US gasoline crack spreads are testing their 2022 all-time seasonal highs and diesel is still well above its five-year range despite easing from its war peaks. The simple crude-surplus story does not explain those margins by itself – cheap feedstock should flow through into cheaper products, but it hasn’t. So it is clear that refineries are not the constraint and demand for fuel is not the problem. Instead, the spread is reflecting either or both of two issues. The first is the local storage problem discussed above – crude is backing up in front of processing capacity that cannot absorb the pace of arrival, because suddenly too much has arrived too quickly into schedules that buyers have already filled through different sources. The second is a mismatch between crude now exiting the gulf and refineries not best configured to run that type. They are logistics and grade-routing problems, not a demand problem, reflecting the two-track divergence that Ending the War on Paper argued the market had not priced, but now apparent in the margin data.
The grade displacement can be seen in discounts against crude from alternative sources. Angolan crude is trading at the largest discount in more than a decade, at times approaching ten dollars below Dated Brent, while the North Sea Brent benchmark has swung from a record premium in April to a discount against futures. Angola’s recent buyer, principally China, is shifting back toward Gulf sour crude as it returns to market and the discount reflects losing that buyer to a cheaper alternative rather than a world short of demand. Grades that captured Asian demand during the closure are being undercut by returning Gulf supply and finding new clearing destinations in Europe. The financial press has misinterpreted these moves as a verdict on the global balance.
What the buffers say
Oil is back near pre-war levels, but meanwhile:
Production remains well below pre-war.
Transit out of the Gulf is well below pre-war.
Transit in – empty vessels returning to load – is even further below pre-war.
Reserves and inventories are well below pre-war.
Markets have been wrong before. Many times.
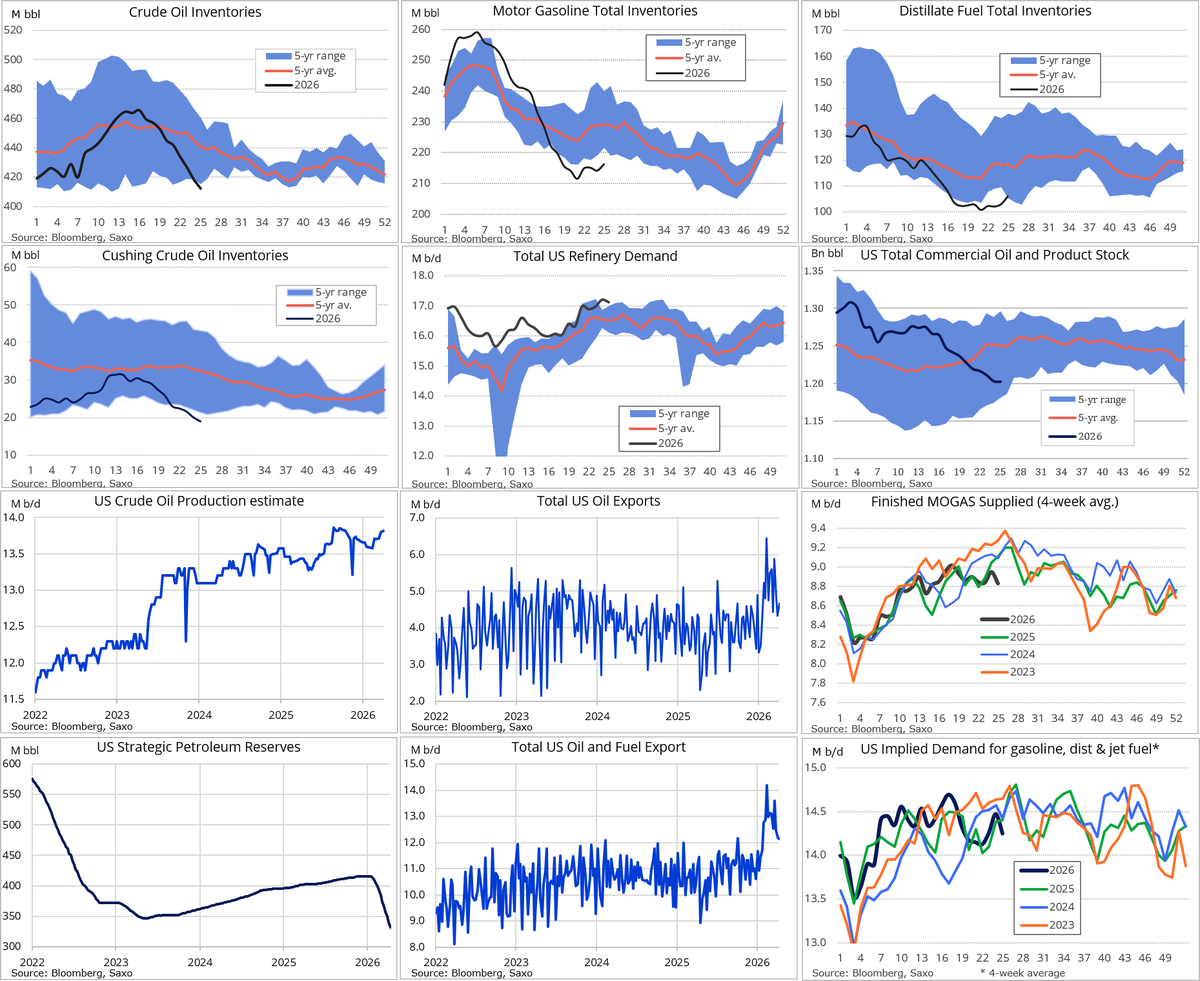
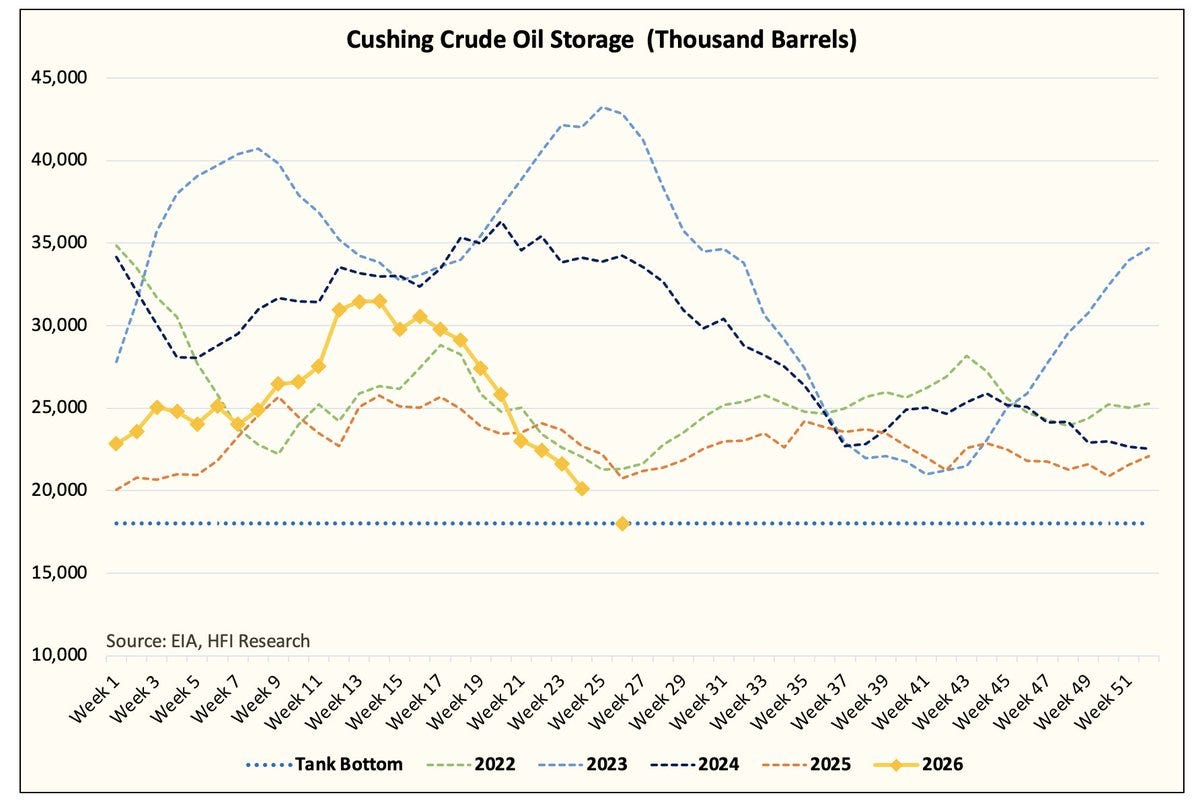
Crude oil inventories are below the five-year range – not merely below average, but outside the historical envelope, while Cushing is near its operational floor. The Strategic Petroleum Reserve (SPR) has fallen from roughly 580 million barrels before the crisis drawdowns began to around 350 million barrels, and total US crude stocks including the SPR fell to their lowest level since 1984. Commercial crude and product stocks – stripping out propane, propylene, and the SPR to get the most operationally relevant measure – are tracking toward their lowest level since at least 2016 by end of July, the projection sitting below the entire historical range shown on the chart, including the COVID trough. The historical relationship between this measure and Brent is unambiguous: when inventories fell to comparable levels in 2022, Brent was above $100. The current price implies the market has decided that relationship no longer holds, with no evidence to support its determination.
US refinery demand dropped sharply during the war but has recovered toward the top of its five-year range, meaning domestic consumption of crude is robust even as export demand softens. US oil exports spiked to record highs as America became the supplier of last resort, which is why domestic inventories drew down so hard and why the export arbitrage is now closing as Gulf crude returns. These readings show a system that absorbed the Hormuz shock by consuming its buffers rather than finding alternative equilibrium, and those buffers are now thin.
On 11 March, IEA member countries agreed to make 400 million barrels of emergency reserves available to the market – the largest collective action in the agency’s history. That release is finite, and as it winds down toward the end of the third quarter, the stocks drawn from government and industry obligation reserves across Japan, South Korea, and Europe will eventually need to be rebuilt, in part through open-market purchases. OECD inventories are on track, on the IEA’s own June forecast, for their lowest level since 2003 by December.
A market generating those readings is not in surplus. It has a temporary prompt glut at the receiving end of a very long supply chain, sitting on top of depleted buffers at the consuming end.
The dark transit question
Some volumes had been moving through dark transits and the UAE’s bypass pipeline before the MOU was signed, so the net new supply entering official visibility is smaller than the gross backlog suggests. How much smaller is uncertain, and the strongest claims about pre-MOU normalisation trace back, directly or indirectly, to US official statements and CENTCOM data – sources with clear institutional incentives to present the reopening as close to normal. The same epistemological caution flagged in Ending the War on Paper applies here: independent vessel-tracking data and official pronouncements are not telling the same story, and the tracking data is the more reliable anchor. Although there is net new supply, its scale should be held with considerably more uncertainty than the financial press has applied to it.
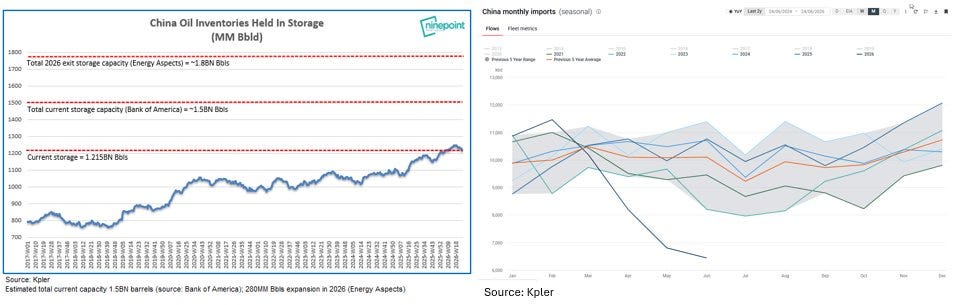
China
The China picture is more complicated, and the bearish case has harder evidence here than elsewhere. Anecdotal trader reports indicate teapot refineries running at utilisation rates near nine-year lows, and of some Chinese refiners offering cargoes for resale rather than absorbing them, suggest demand weakness that goes beyond the receiving-end bottleneck. If that reflects something durable – refineries operating at structurally lower rates or consumption patterns permanently shifted – then the weakness extends well beyond the Hormuz normalisation timeline. If it reflects temporary feedstock disruption, suppressed margins during the war, and deliberate inventory drawdown as a policy response to high prices, then Chinese demand returns as Gulf crude falls and feedstock costs normalise. The data is not yet conclusive either way, and the wave argument depends partly on a variable that cannot be resolved from current information.
The option Iran is preserving
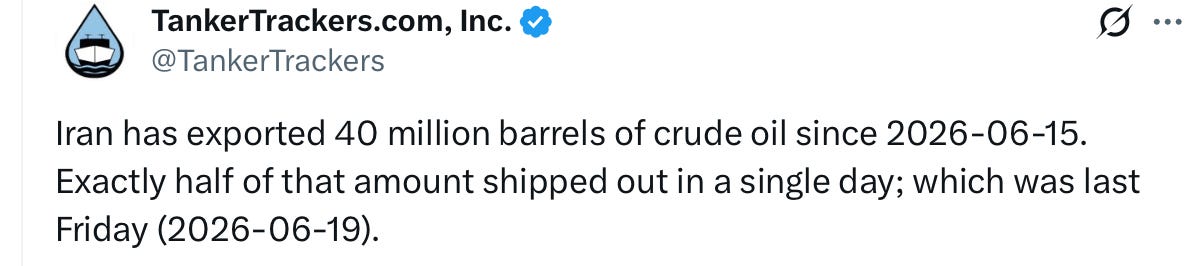
TankerTrackers data shows Iran exported approximately 40 million barrels of crude between 15 and 25 June, with 20 million of those moving in a single day on 19 June – several days before the formal US sanctions licence took effect. That is not the pace of a party easing cautiously back into the market.
The IRGC has since declared the new Omani shipping corridor “unacceptable and perilous”, and analysts tracking the Strait note that the longer transits continue on the Oman lane without Iranian enforcement, the greater the pressure on Iran to escalate in order to reassert control.
Iran need not be acting in bad faith to behave this way. It is simply acting rationally under uncertainty, as any party would when negotiating with a counterparty whose principals were saying opposite things in public throughout the talks, under an agreement whose central precondition – an end to the war in Lebanon – remains unmet. Iran is shipping barrels now in record volumes, to bank oil export receipts regardless of what happens next, while the precondition remains on the record, available as a basis for reasserting closure if the wider negotiation fails.
At $73 Brent, the price does not appear to be carrying any of that residual risk. The supply now pressing on the contango may prove shorter-lived than the market is assuming, because the party that opened the waterway has arranged the agreement to preserve the option of closing it again, and the pace at which it is moving oil suggests it is not counting on the full 60 days.
What the signal means
The contango tells you about the cost of moving and storing oil right now – where prompt barrels are in excess of what the immediate receiving infrastructure can absorb. But it is not a window into the fourth quarter, when the emergency release winds down, when reserve rebuilds begin competing for the same barrels, when resumed Hormuz shipping must deliver current production rather than clear a pre-loaded backlog, and when the Lebanon question either resolves or doesn’t. The argument in Ending the War on Paper was about that sequence, and the contango flip, however well-timed to cause maximum inconvenience, does not address it.
What the curve is measuring is a queue, not a surplus – and the queue, unlike a surplus, has an end.
This is a heady piece. I wonder if you can draw some conclusions from your deep dive above regarding the future price of oil and main risk factors.